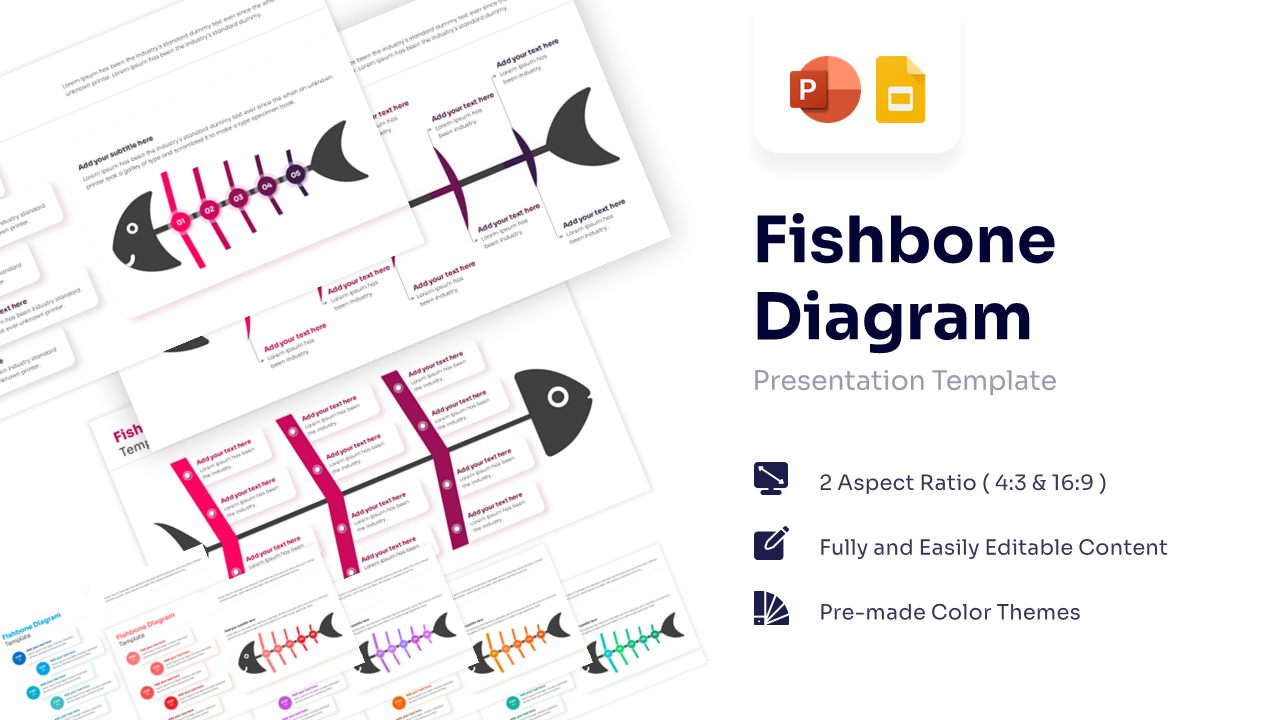
Blank Fishbone Diagram Template for PowerPoint & Google Slides


Creative Ishikawa Cause and Effect Presentation Template
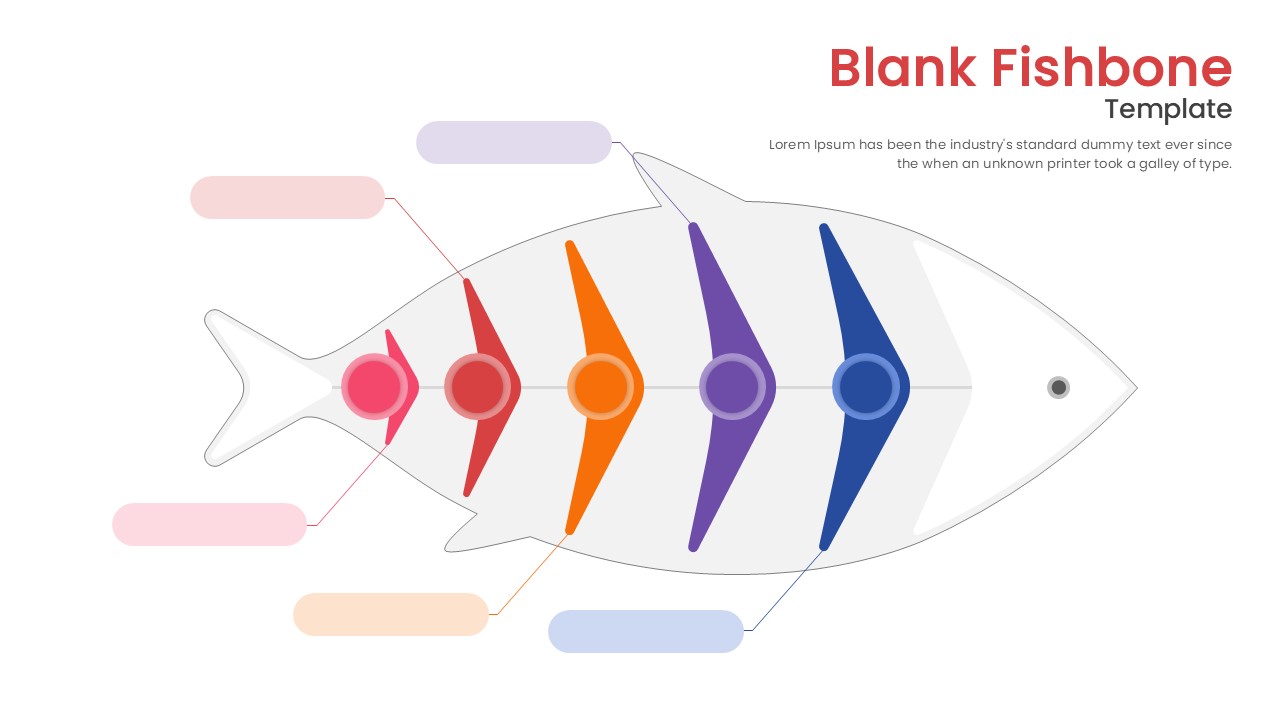
Download this Blank Fishbone Template to clearly identify the root causes of any problem during your team meetings. This fishbone infographics are perfect for structured brainstorming sessions where you need to visualize the direct relationship between a specific effect and its contributing factors.
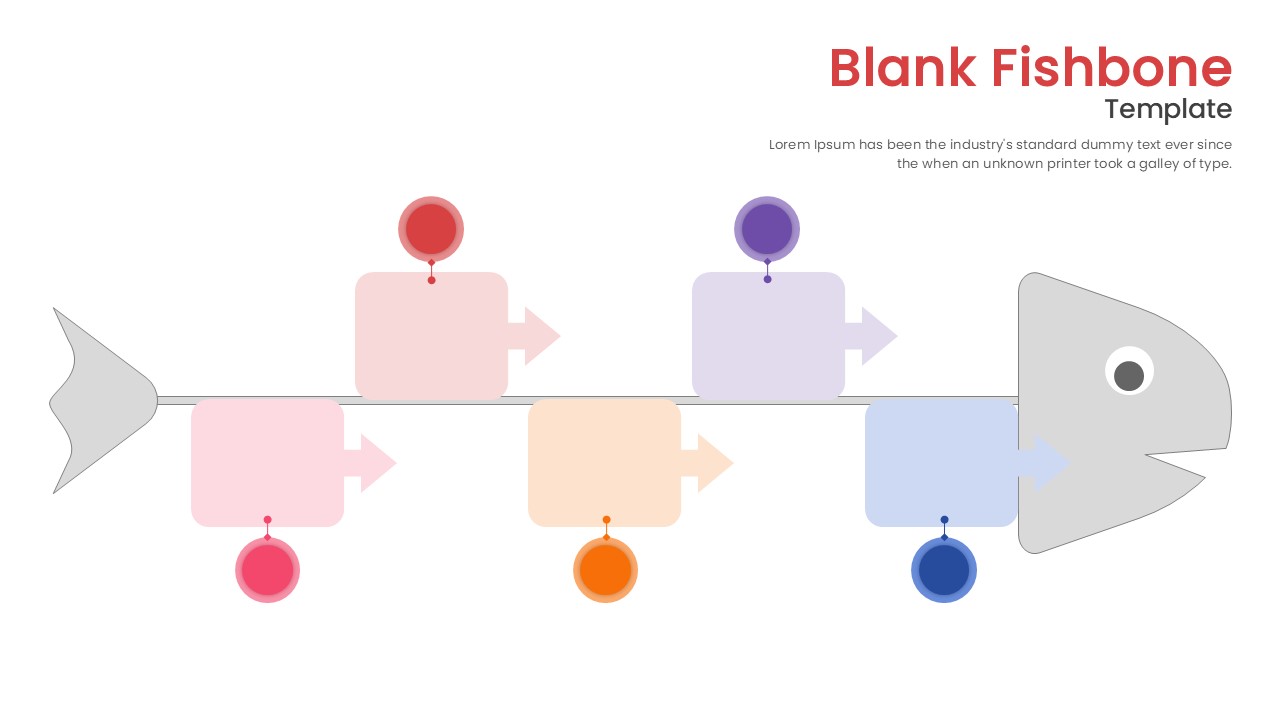
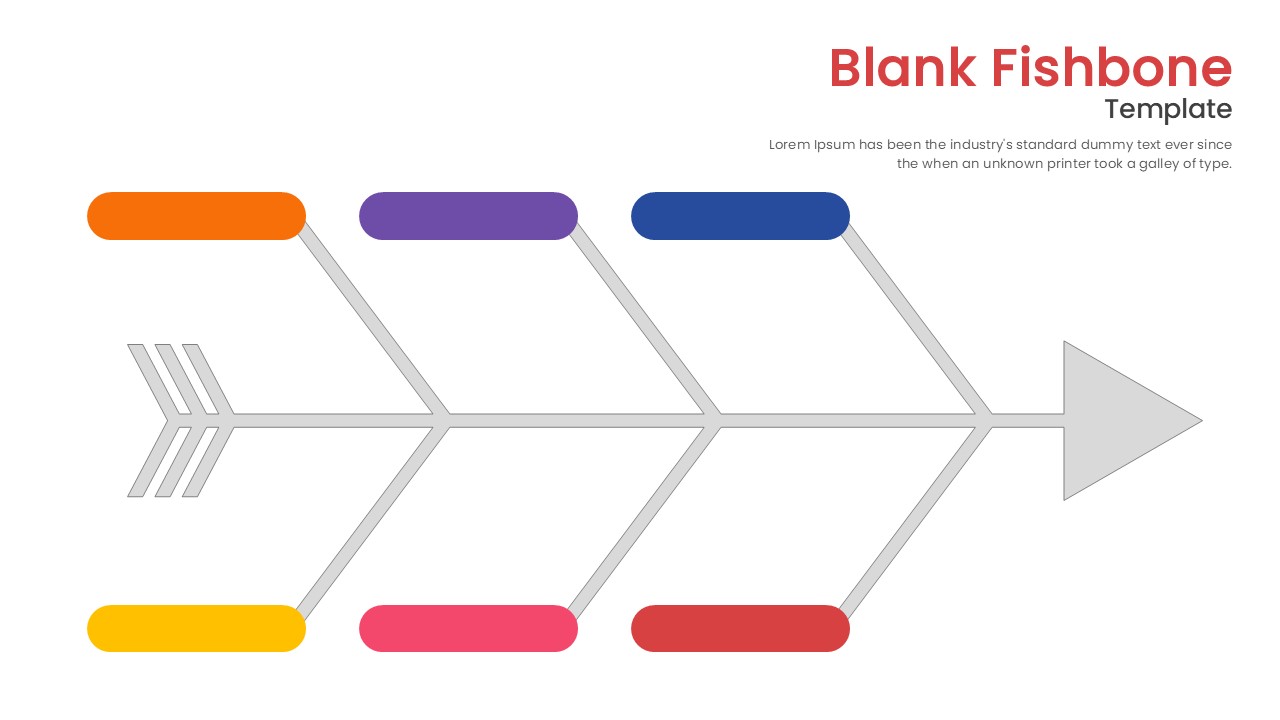
The blank Ishikawa template includes various layouts, ranging from creative fish illustrations with curved spines to standard linear Ishikawa diagrams. You will find color-coded segments and organized text placeholders that make it simple to categorize inputs like equipment, process, or people without starting from scratch.
These fishbone diagram templates are ideal for manufacturing quality control, business strategy reviews, or medical case analysis to map out symptoms. You can also use them in educational workshops to teach critical thinking or in project management meetings to troubleshoot unexpected delays and bottlenecks.
Why Use this Fishbone Infographic Template
- Visualizes complex relationships between causes and effects clearly.
- Encourages structured participation during team brainstorming.
- Saves time on design so you can focus on analysis.
- Adapts easily to different industries like healthcare or manufacturing.
Who is it for
- Project Managers
- Quality Assurance Teams
- Business Analysts
- Educators and Trainers
Key Features
- 100% Vector-Based Graphics
- Fully Layered & Organized
- Multi-Platform Support
- Theme Color & Theme Font
Frequently Asked Questions
- What is a fishbone diagram used for?
- It is used to identify the root causes of a problem by categorizing potential factors.
- Can I change the colors of the fishbone segments?
- Yes, all shapes and lines are fully editable in PowerPoint and Google Slides.
- Is this template suitable for print?
- Yes, the vector graphics ensure high-quality output for handouts or posters.
Related Templates
-
 Free
Free -

-

-
 $3.99
$3.99