Your Cart
0 Assets added
Your cart is empty.
Home Free Business Process Workflow Flowchart Template for PowerPoint & Google Slides Vertical Flowchart Diagram Template
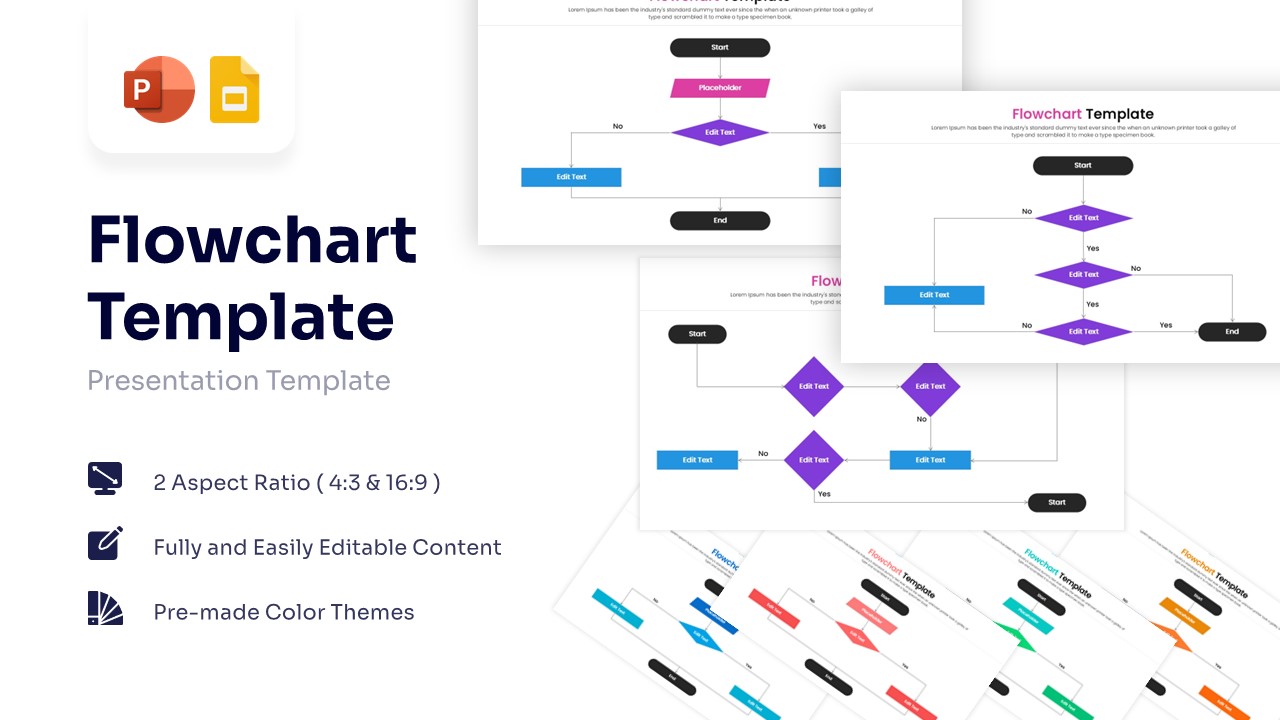
Vertical flowchart diagram with purple decision diamonds and blue process steps
Product Highlights
No. of Slides
Category
Compatable With
Rating
0/5
(0 reviews)
Item ID
Author
Tags