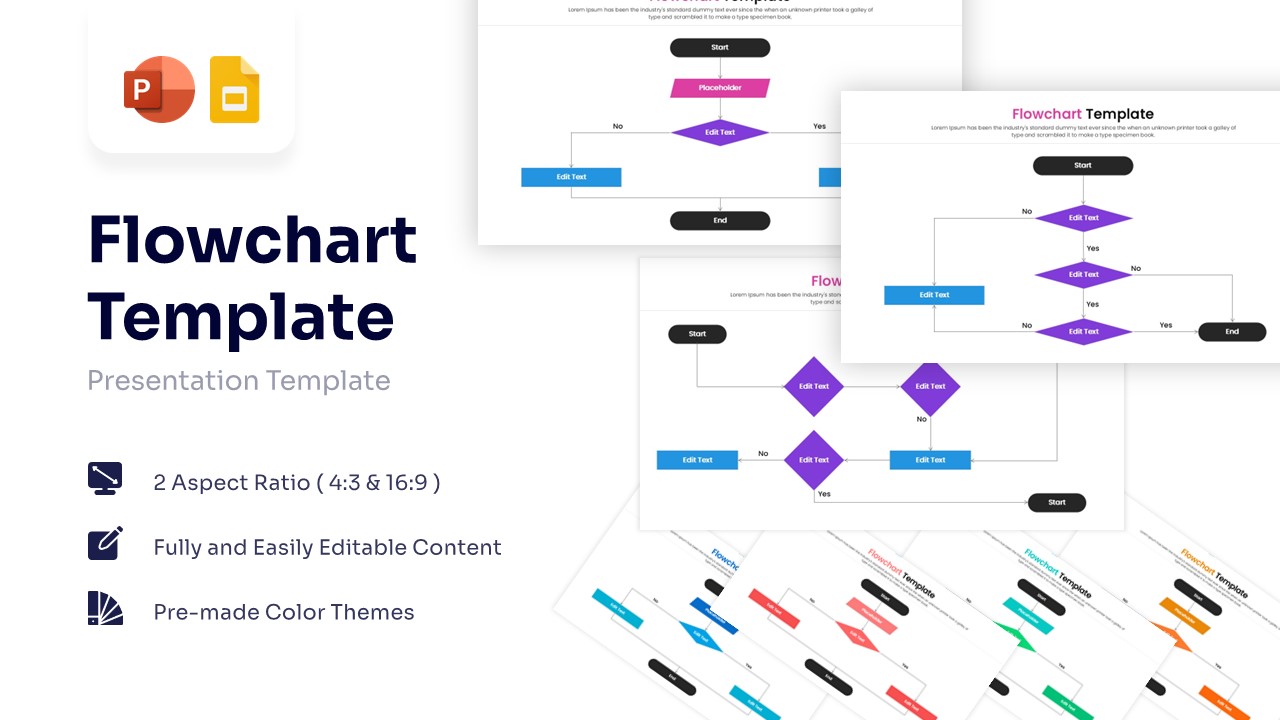
Strategic Decision Tree Flowchart Template for PowerPoint & Google Slides
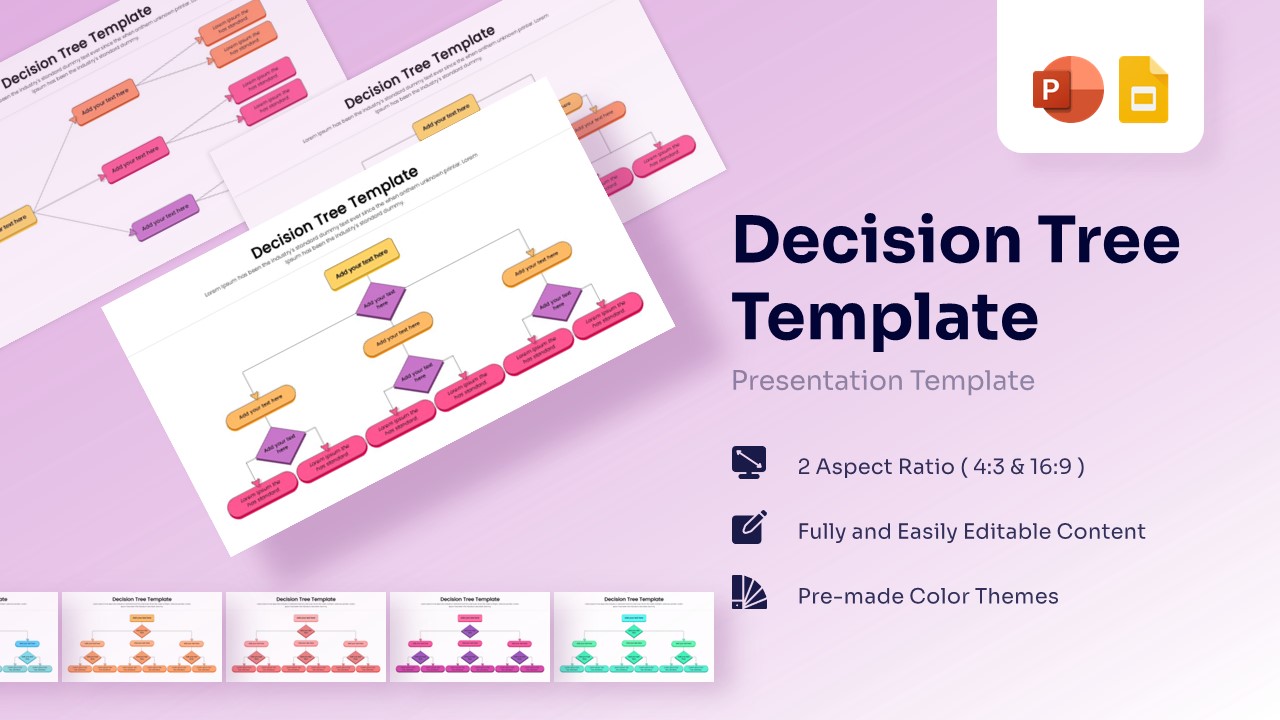

Hierarchical Decision Making Process Presentation Template
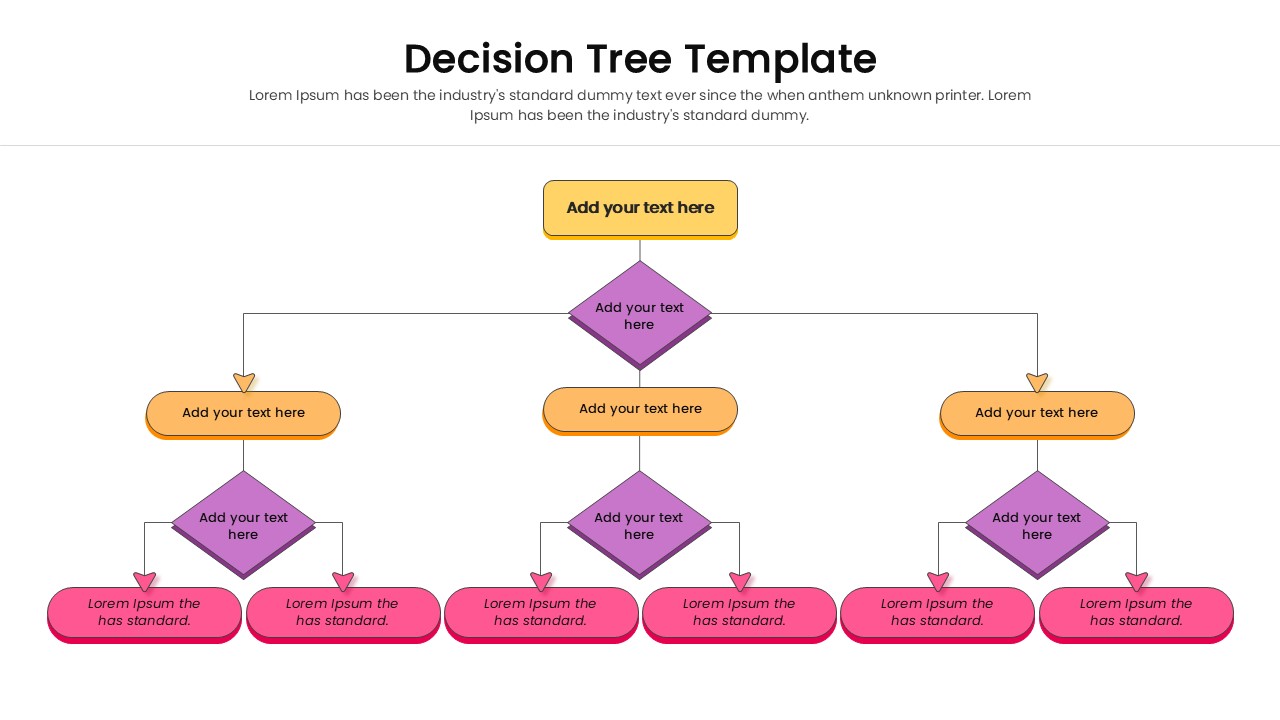
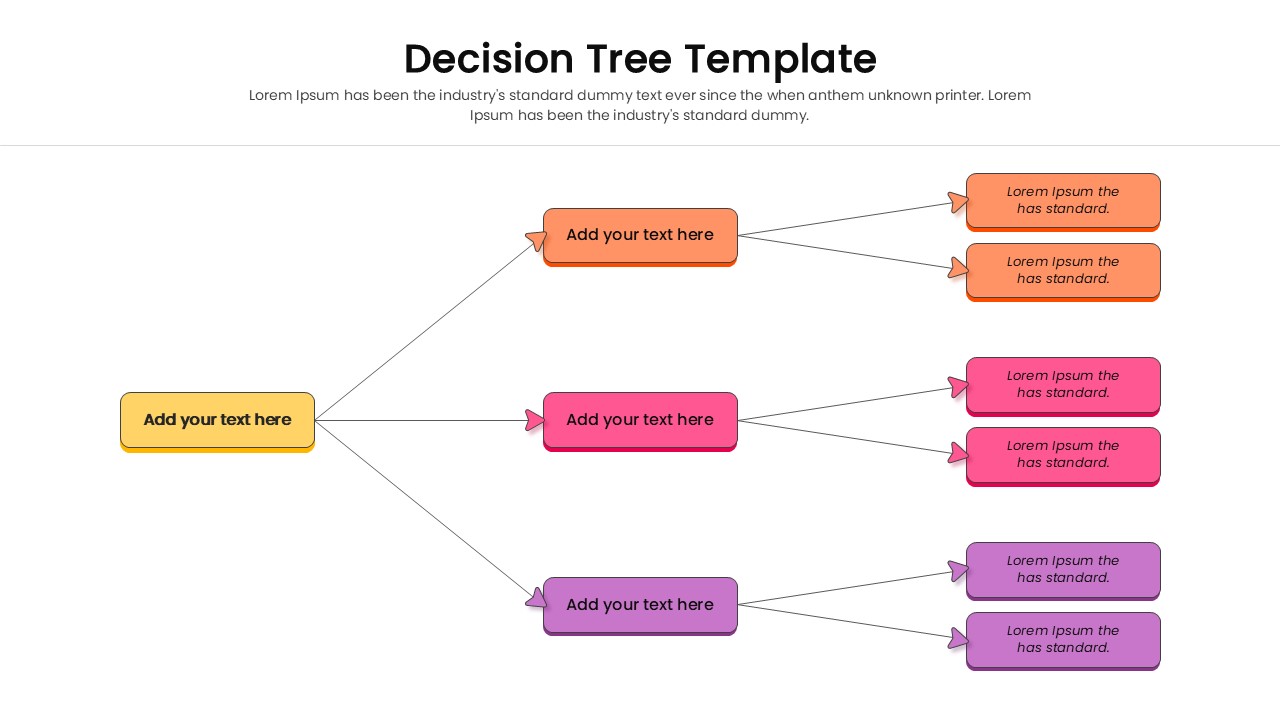
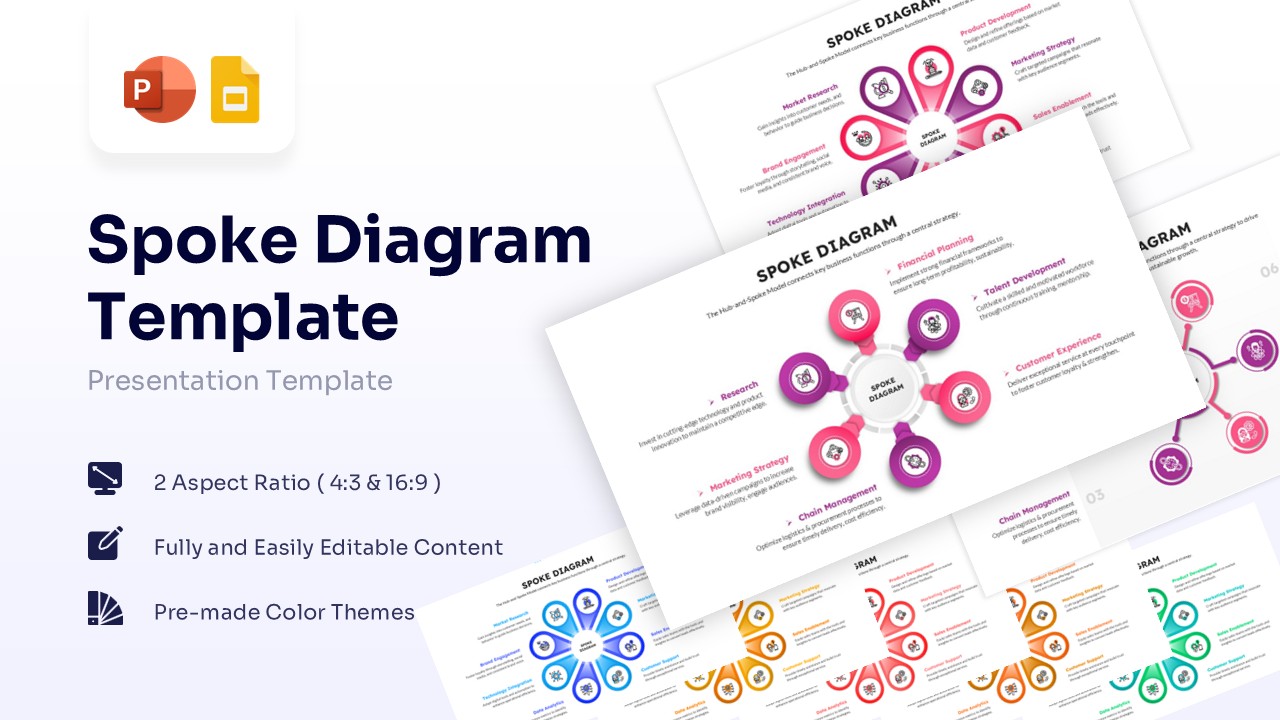
Download this Decision Tree Template to map out choices and visualize potential outcomes clearly. Whether you are evaluating business strategies or defining a logic process, this simple hierarchical infographics helps stakeholders understand the path from a central question to a final resolution. It simplifies complex branching paths into an easy-to-follow visual story.
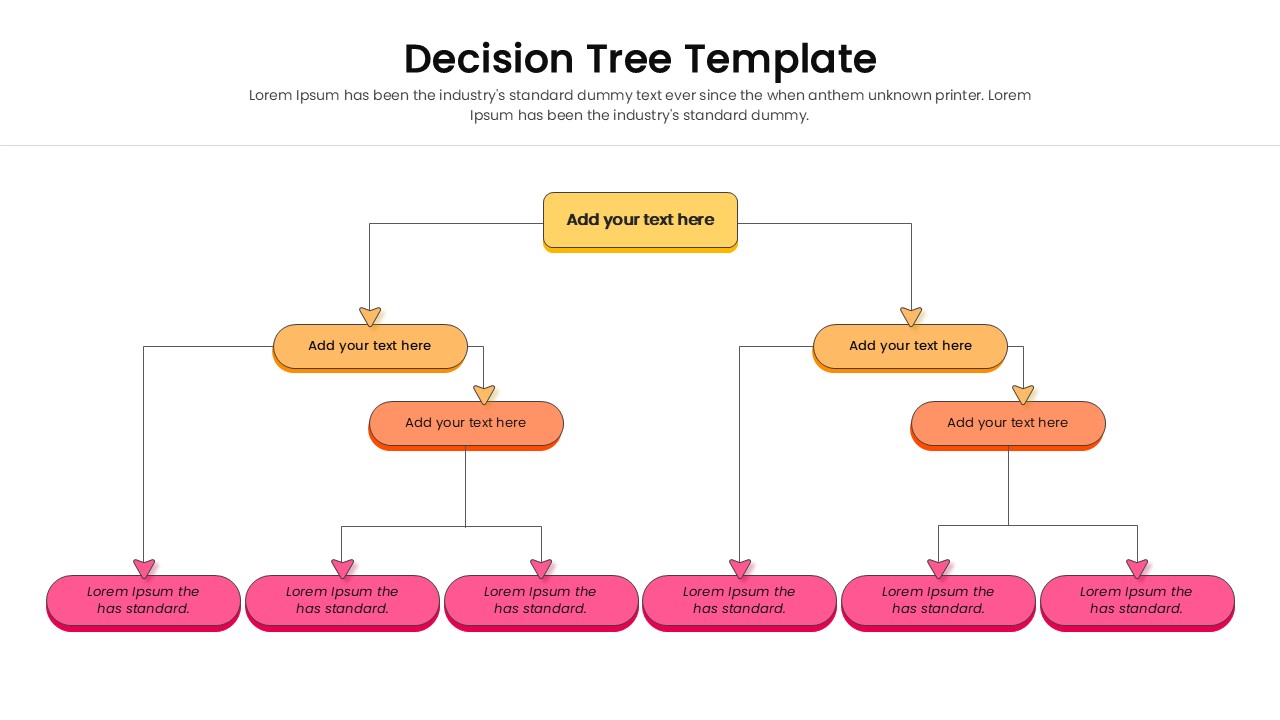
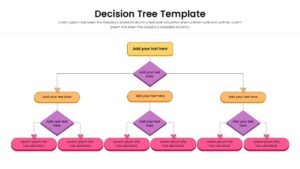
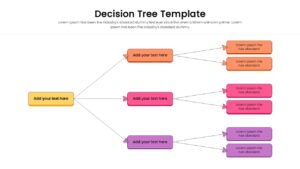
The design features a structured flowchart diagram with distinct shapes and connecting lines to represent decision nodes and results. With clear color separation—using yellow for the main topic, orange for options, and purple for sub-decisions—you can guide your audience through complex information without confusion. The clean connectors and spacious layout ensure that your text remains readable, even when explaining intricate steps.
This Decision Tree Diagram is ideal for operational planning, risk assessment meetings, and problem solving workshops. You can also use it for creating organizational charts, mapping user journeys in product development, or illustrating algorithm logic for technical teams. It effectively transforms abstract logic into a concrete roadmap that everyone in the room can follow.
Why Use this Decision Tree Template
- Visualizes consequences of decisions to support better planning.
- Simplifies complex logic for non-technical audiences.
- Saves time on formatting connectors and alignment.
- Helps teams align on processes and expected outcomes.
Who Should Download this Flowchart Template
- Project Managers planning project phases and contingencies.
- Business Analysts mapping out operational workflows.
- Data Scientists explaining algorithms or logic flows.
- Consultants presenting strategic options to clients.
Key Features
- 100% Vector-Based Graphics for sharp scaling.
- Fully Layered & Organized elements for easy editing.
- Two Aspect Ratios (4:3 & 16:9) included.
- Pre-made Theme Color & Theme Font support.
Frequently Asked Questions
- Can I change the colors of the shapes?
- Yes, all shapes and lines are fully editable. You can match them to your brand colors using the theme settings or manual adjustments.
- Does this work for organizational charts?
- Absolutely. The hierarchical structure is perfect for showing reporting lines and team structures.
Related Templates
-
 $2.99
$2.99 -
 $3.99
$3.99 -
 Free
Free -