bar chart infographic template for powerpoint and google slides
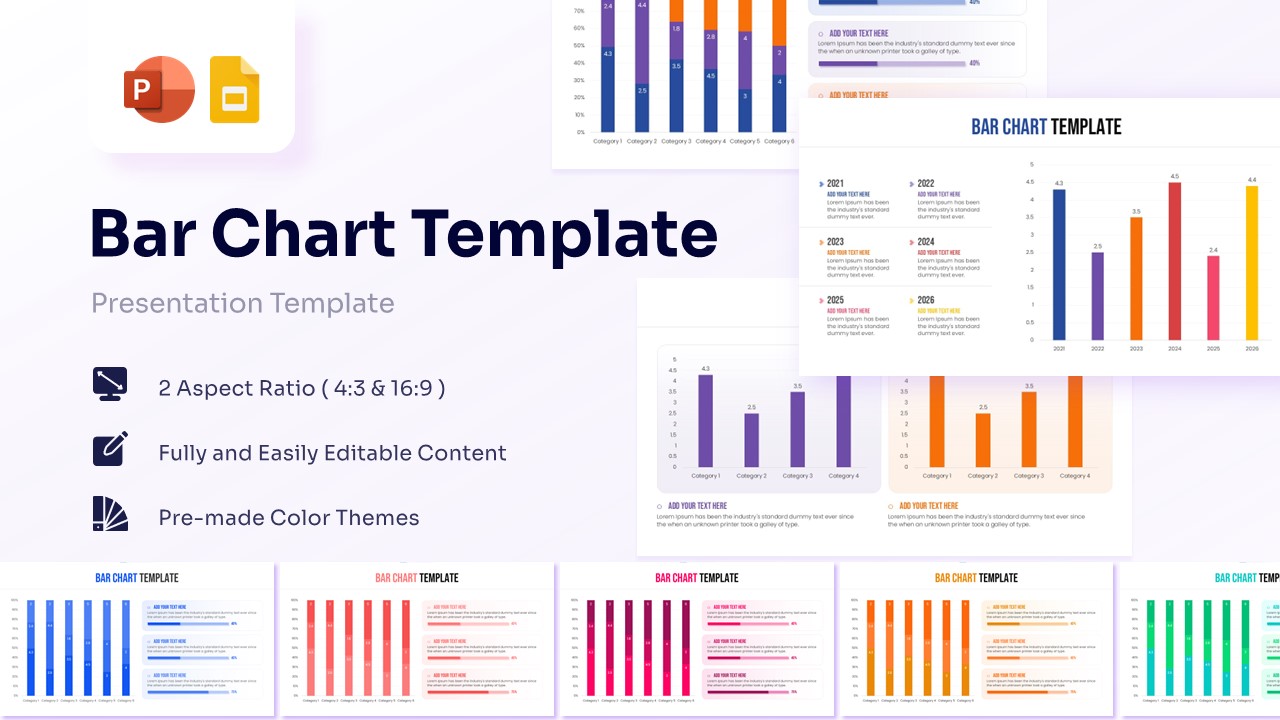
This template is part of a deck featuring multiple slides. To check out all slides.
See AllBar Chart Comparison Presentation Template
Download this Bar Chart Infographic Template to transform complex data into clear, actionable insights for your next business meeting or project report. This bar and column chart template allows you to present categorical comparisons, growth trends, and statistical distributions with professional ease. Whether you are comparing quarterly sales or tracking annual performance, these bar and column charts provide the visual clarity needed to keep your audience engaged and informed.
This Bar Chart Comparison Template features various layouts, including clustered bar charts, stacked percentage columns, and year-on-year growth trackers. Each slide is designed with a focus on readability, using high-contrast color palettes and clean typography to ensure your metrics stand out. With integrated text placeholders, you can easily add context, summaries, or key takeaways directly alongside your data points, making it a complete solution for data-driven storytelling.
These free chart templates are ideal for a wide range of professional use cases, from financial forecasting and market share analysis to academic research and social media performance tracking. Instead of building charts from scratch, you can simply plug in your numbers and customize the appearance to match your corporate branding. The flexible design ensures that your data remains the hero of the slide, helping you communicate results with confidence and precision.
Why Use this Comparison Bar Chart Template
- Simplifies complex statistical data for better audience retention.
- Streamlines the report-making process with pre-designed data visualizations.
- Enhances the visual appeal of financial and analytical presentations.
- Provides a consistent look across different types of bar and column graphs.
Who Should Download this Bar Chart Diagram
- Financial analysts and accountants presenting annual or quarterly reports.
- Marketing professionals tracking campaign performance and conversion rates.
- Project managers visualizing resource allocation and milestone progress.
- Educators and students needing clear charts for academic research or thesis defense.

