Radial Gauge Chart Template for PowerPoint & Google Slides
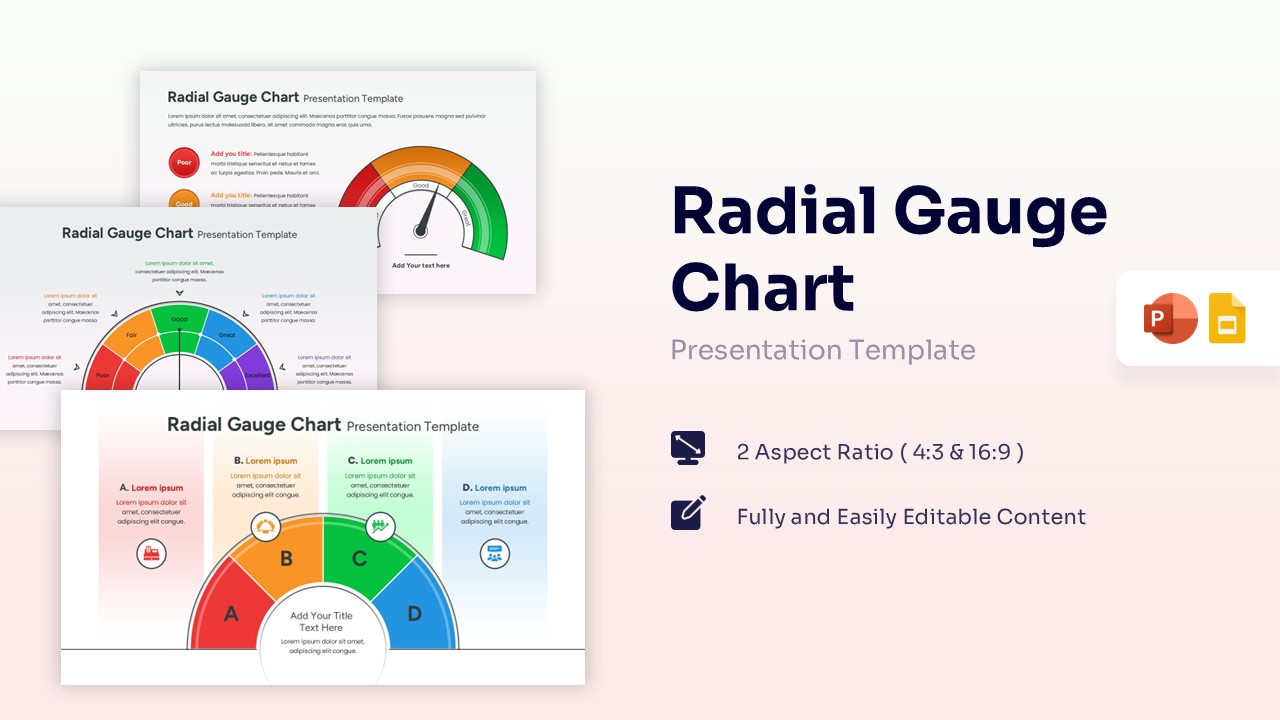


Radial Gauge Infographic Presentation Template
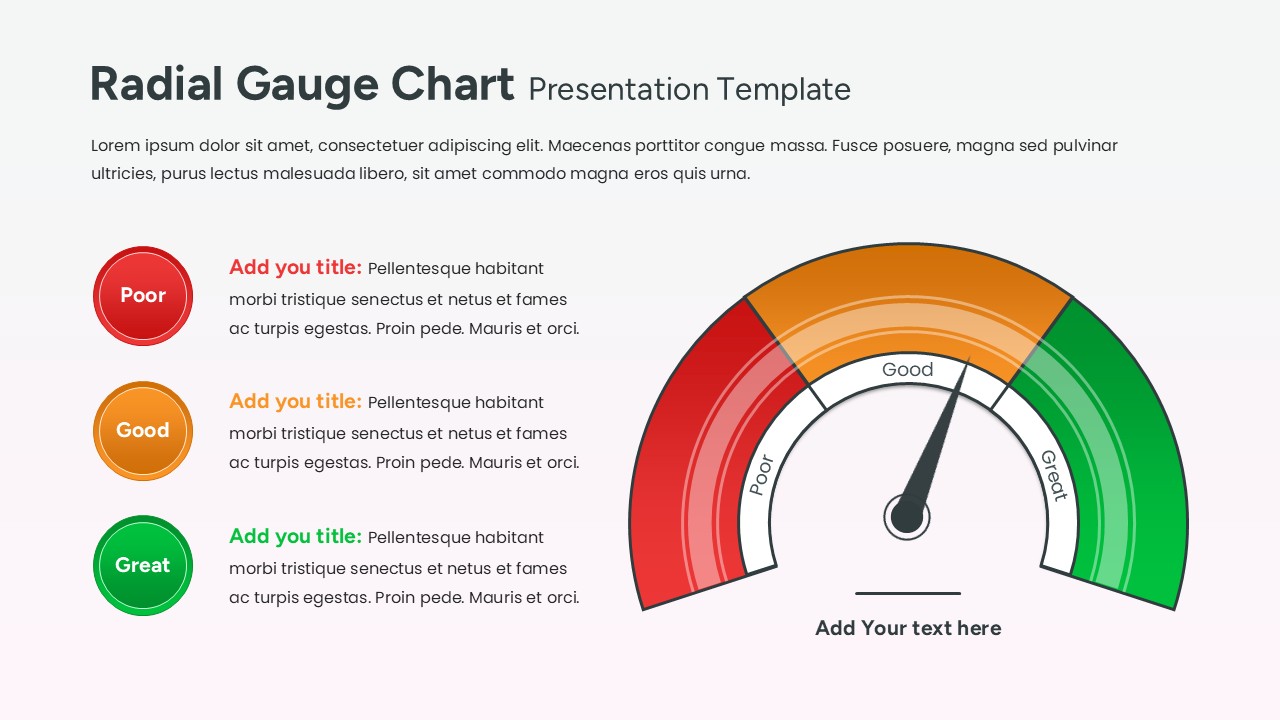
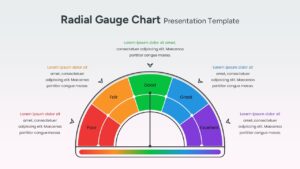
Download this Radial Gauge Chart Template to visualize performance metrics, risk levels, or project statuses with clear, professional speedometers. Whether you are tracking a sales goal or assessing a department’s health, these chart and graph template help you turn complex data into a simple visual story. By using a semi-circular layout, you can easily show where your results stand on a scale from “Poor” to “Excellent,” making your data instantly understandable for any audience.
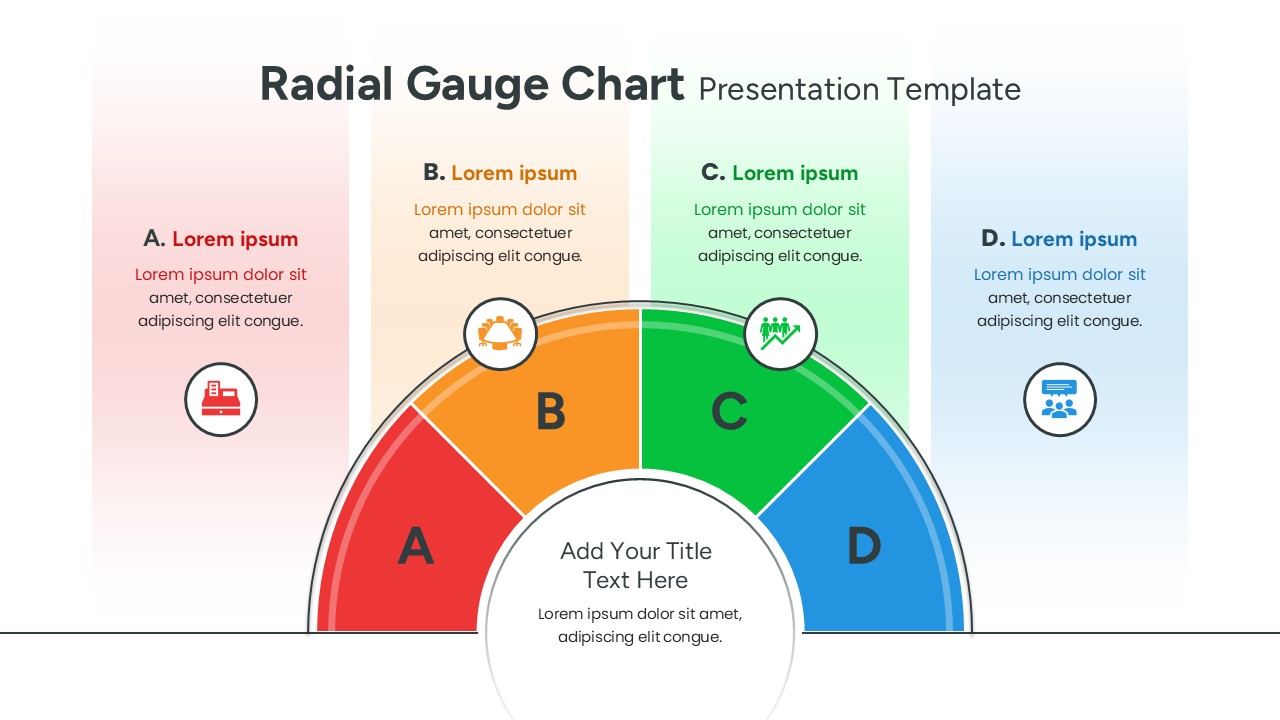
This Radial Gauge Meter features various speedometer styles, including four-segment layouts and traditional needle-indicator gauges. Each slide is designed to be high-contrast and easy to read from the back of a room. With built-in icons and dedicated text areas, you can explain the “why” behind the numbers without cluttering your deck. These data visualization tools are perfect for regular business updates where you need to communicate progress quickly and effectively.
You can use these radial charts for a wide variety of business needs, such as financial health checks, customer satisfaction scores, or marketing campaign effectiveness. They work beautifully as standalone slides or as part of a larger executive dashboard. Simply pick the gauge style that fits your data—whether it’s a simple three-step status or a more detailed five-point scale—and drop it into your existing presentation.
Why Use this Radial Gauge Chart Template
- Simplifies complex performance metrics into easy-to-read speedometer visuals.
- Enhances audience retention with high-contrast, color-coded status segments.
- Reduces preparation time with pre-built layouts for performance tracking and goal monitoring.
- Ensures a professional and polished look for executive-level reporting and business reviews.
Who Should Download this Radial Meter Template
Business analysts, project managers, and department heads who need to report on KPIs or project health. It is also ideal for sales teams tracking targets, HR professionals presenting employee engagement scores, and consultants providing strategic health checks. Other uses include marketing performance summaries, financial risk assessments, and quarterly business reviews.
Key Features
- 100% Vector-Based Graphics
- Fully Layered & Organized
- Multi-Platform Support
- Theme Color & Theme Font
Frequently Asked Questions
- How do I change the position of the needle?
- The needle is a vector element; simply click on it and use the rotation handle to point it toward your desired data segment.
- Can I change the colors of the gauge segments?
- Yes, every segment is a separate shape. You can use the \"Shape Fill\" tool to match your specific brand colors or status meanings.
- Is this template compatible with widescreen monitors?
- Absolutely. This pack includes both 4:3 and 16:9 aspect ratios to ensure your charts look great on any screen or projector.
Related Templates
-
 $3.99
$3.99 -
-
 Free
Free -
 Free
Free