Your Cart
0 Assets added
Your cart is empty.
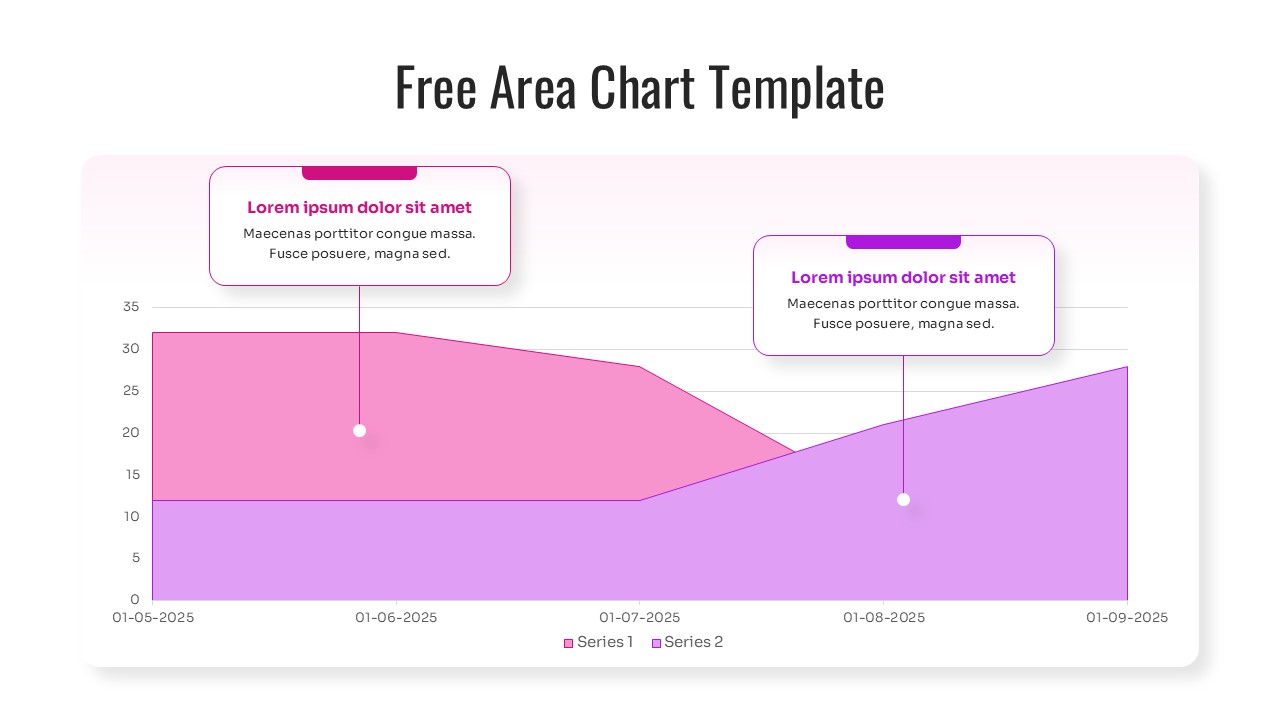
Home Free Data Visualization Area Chart Template for PowerPoint & Google Slides Monthly Performance Area Graph
Modern area chart layout with 100% vector graphics and clean professional typography
Product Highlights
No. of Slides
Category
Compatable With
Rating
0/5
(0 reviews)
Item ID
Author
Tags