Free Pie Chart Template for PowerPoint & Google Slides
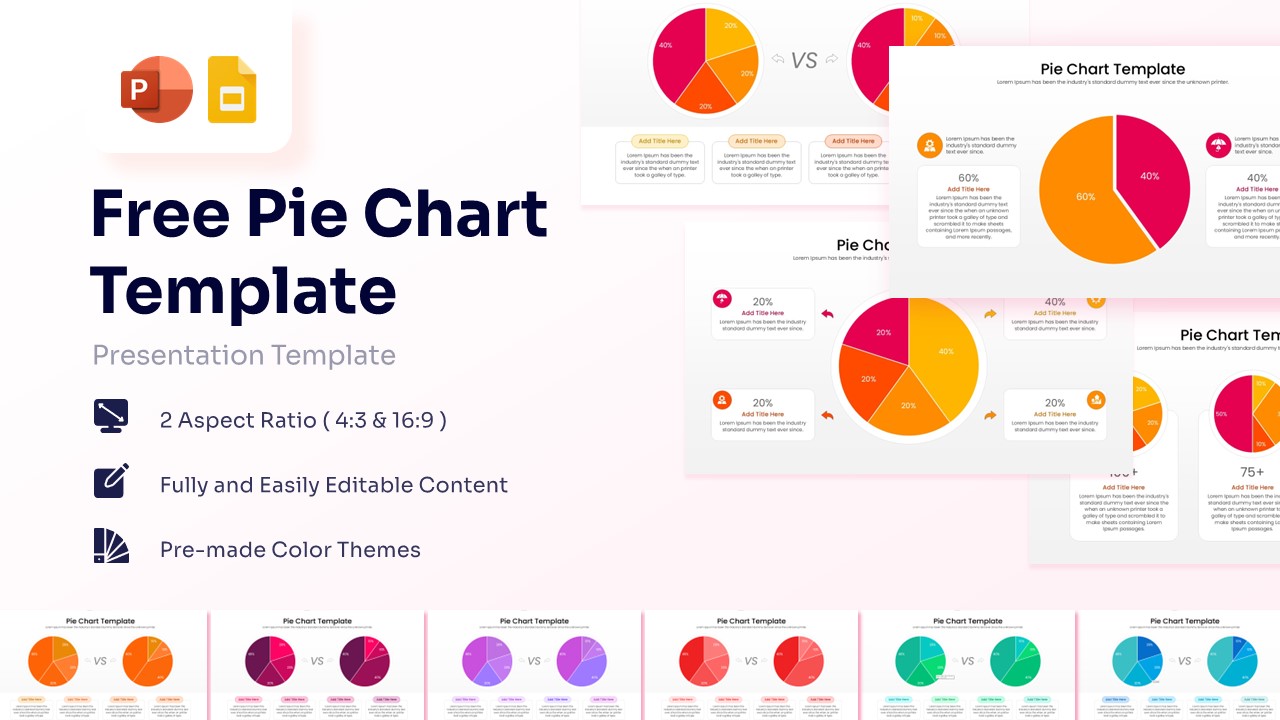


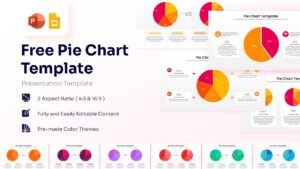


Data Comparison Pie Chart Presentation Template
Download this Pie Chart Template and use it to transform complex data into a clear, professional visual story on PowerPoint or Google Slides. Whether you are tracking market shares or comparing project results, this Pie & Donut Chart template helps you stay in control of your presentation. The clean layout ensures your audience understands the numbers instantly, allowing you to focus on the conversation rather than explaining the chart. Each slide is designed to be supportive and easy to navigate, making your prep work feel light and manageable.
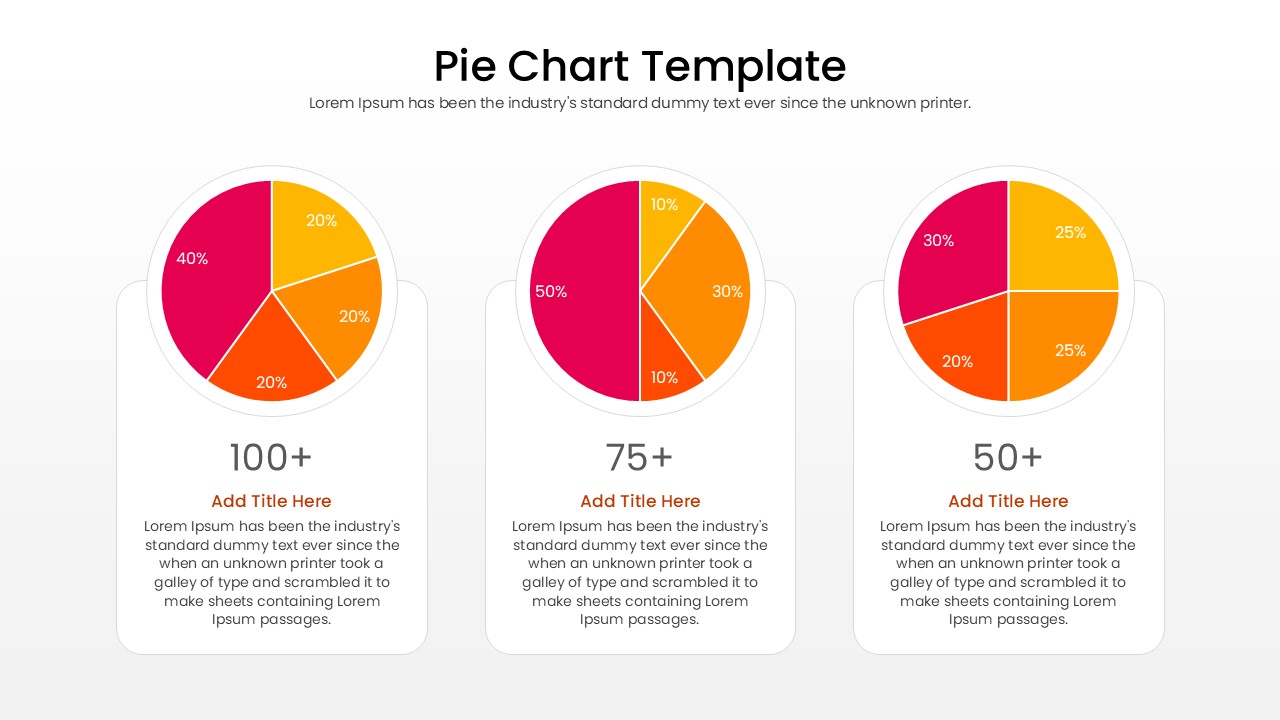
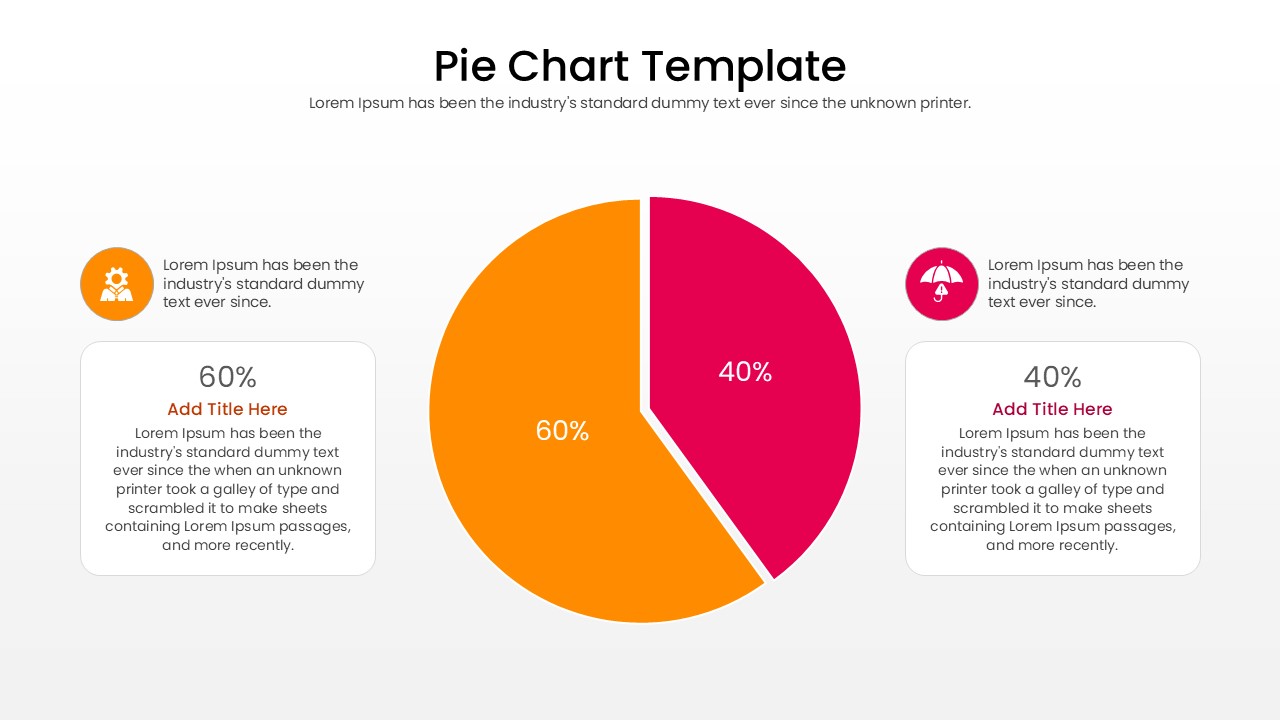
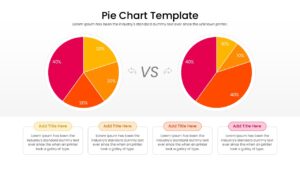
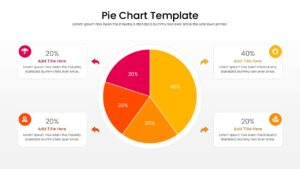
This Pie Chart PowerPoint Template features a variety of data visualization layouts, including comparison pie charts, percentage breakdowns, and multi-segment circles. It uses a professional palette of orange, magenta, and yellow to create high contrast that keeps viewers engaged. By using these secondary keywords like circular infographics and data distribution slides, you can ensure your deck looks polished. The pre-made color themes and vector-based graphics mean you can resize elements without losing clarity, maintaining a sharp look on any screen size.
These PowerPoint Chart & Graph Templates can be used for quarterly business reviews, financial summaries, or educational workshops. In a corporate setting, use the “VS” comparison slide to highlight growth between two fiscal periods or to show a side-by-side competitor analysis. For project management, the multi-chart layout is perfect for displaying resource allocation across different departments or tracking the completion status of various milestones.
- Helps you visualize data quickly to save time during deck preparation.
- Provides a structured way to present percentages and proportions clearly.
- Ensures a polished, professional aesthetic that builds trust with your audience.
- Simplifies complex statistical information into digestible visual segments.
- Business analysts and data researchers presenting market trends or survey results.
- Marketing managers tracking campaign performance and segment distribution.
- Educators and students creating clear, visual lesson plans or thesis defenses.
- Project leads needing to report on budget allocation or team progress.
Why use this Pie Chart Template
- Visualizes data distribution instantly for better audience retention.
- Reduces prep time with ready-to-use comparison layouts.
- Maintains high resolution across different screen aspect ratios (4:3 and 16:9).
- Allows for effortless customization to match your specific brand guidelines.
Who Should Download this Pie Chart PowerPoint Template
- Busy professionals who need to present data-driven insights with confidence.
- Sales teams demonstrating market share or customer demographics.
- Accountants and financial officers presenting annual budget breakdowns.
- Consultants providing strategic overviews and competitive comparisons.
Key Features
- 100% Vector-Based Graphics
- Fully Layered & Organized
- Multi-Platform Support
- Theme Color & Theme Font
Frequently Asked Questions
- Can I edit the percentage values in this pie chart template?
- Yes, every text box and data label is fully editable. You can simply click and type your specific figures to match your data.
- Does this template work with both 4:3 and 16:9 aspect ratios?
- Absolutely. We have included both standard and widescreen formats to ensure your presentation looks great on any projector or monitor.
- Can I change the colors to match my company branding?
- Yes, the template uses theme colors. You can change the entire color scheme with just a few clicks within PowerPoint or Google Slides settings.
Related Templates
-
Wellness Wheel Template for PowerPoint & Google Slides
Charts & Graphs
$2.99 -
-
-