Your Cart
0 Assets added
Your cart is empty.
Home 3D Iceberg Template for PowerPoint & Google Slides 3D Iceberg Diagram
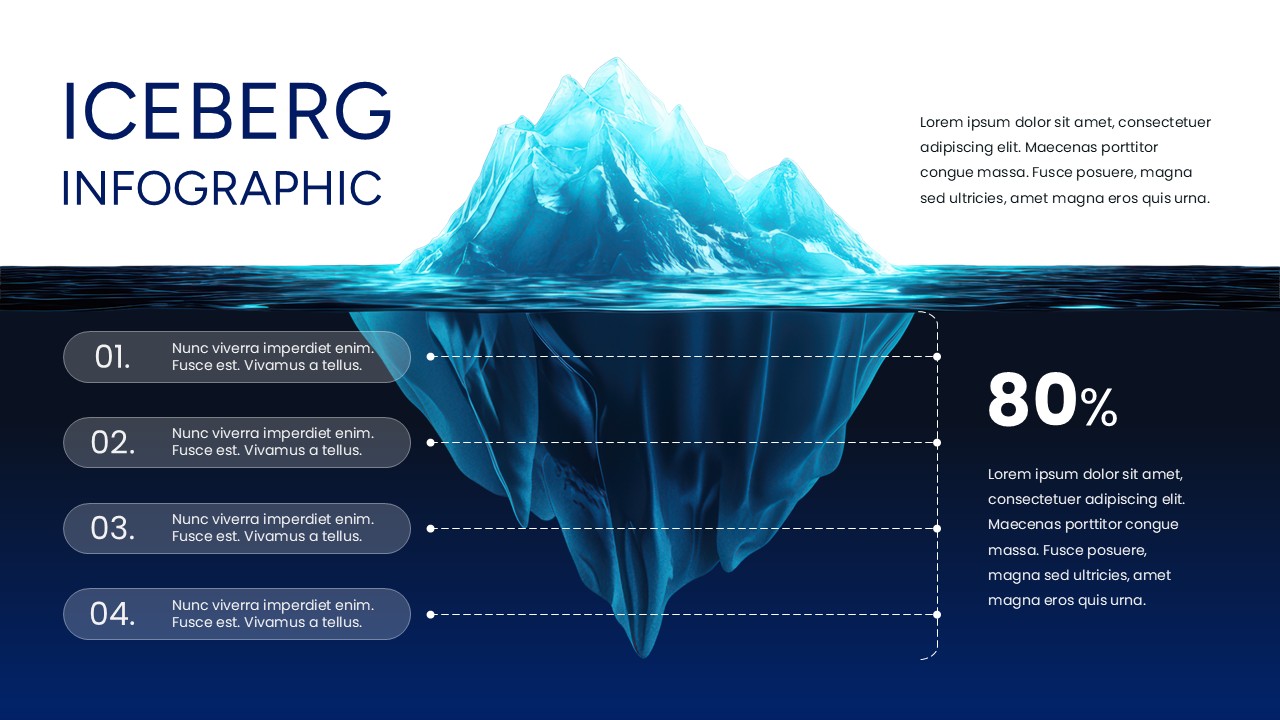
3D Iceberg Template with four horizontal text labels and 80 percent data indicator on a dark blue sea background
Product Highlights
No. of Slides
Category
Compatable With
Rating
0/5
(0 reviews)
Item ID
Author
Tags