Your Cart
0 Assets added
Your cart is empty.
Home Professional Line Chart Template for PowerPoint & Google Slides Multi Line Comparison Slide
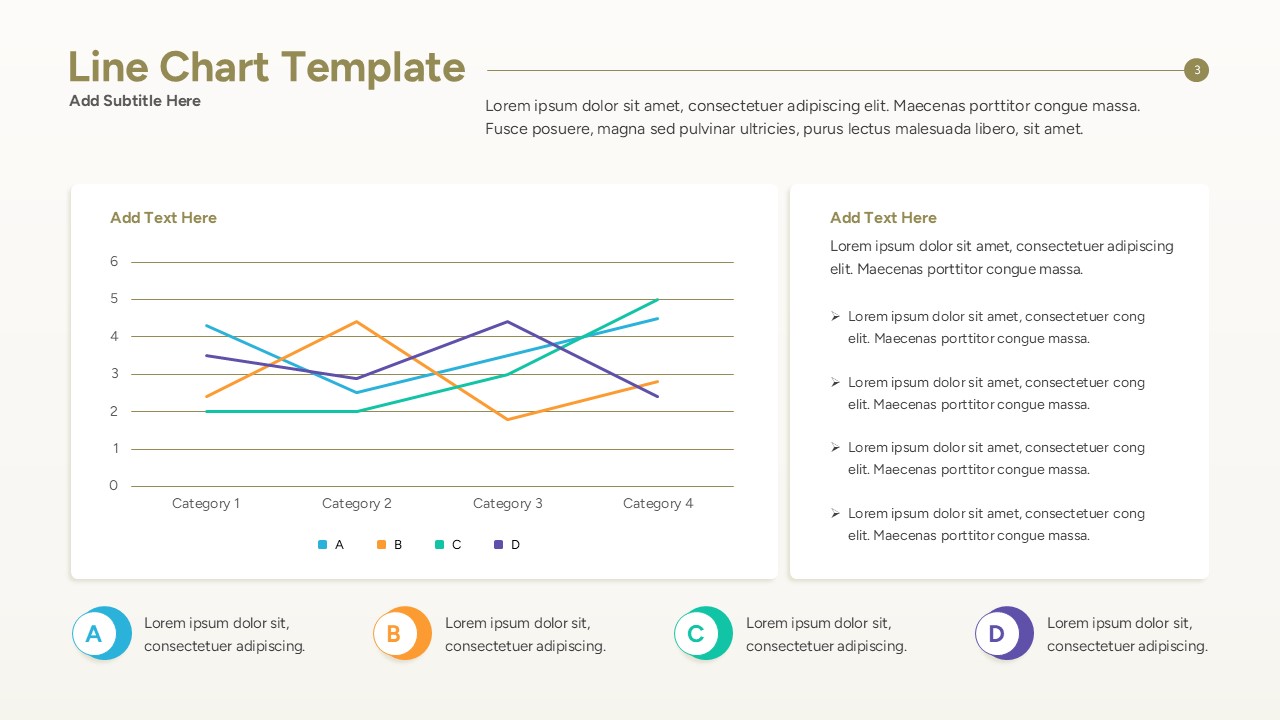
Professional line chart PowerPoint slide with four color-coded lines and a side panel for descriptive bullet points
Product Highlights
No. of Slides
Category
Compatable With
Rating
0/5
(0 reviews)
Item ID
Author
Tags