Your Cart
0 Assets added
Your cart is empty.
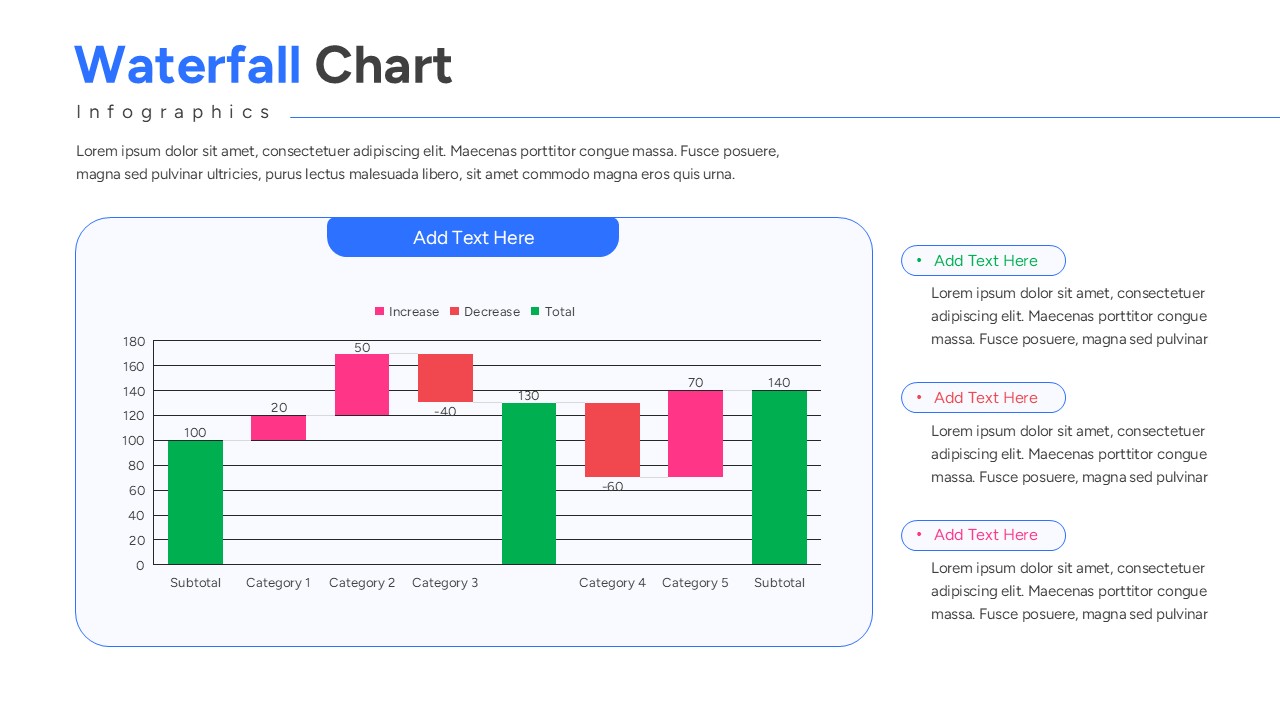
Home Waterfall Chart Template for PowerPoint & Google Slides Waterfall Chart Infographic
Financial data visualization slide with green and red bars representing profit and loss increments
Product Highlights
No. of Slides
Category
Compatable With
Rating
0/5
(0 reviews)
Item ID
Author
Tags