Your Cart
0 Assets added
Your cart is empty.
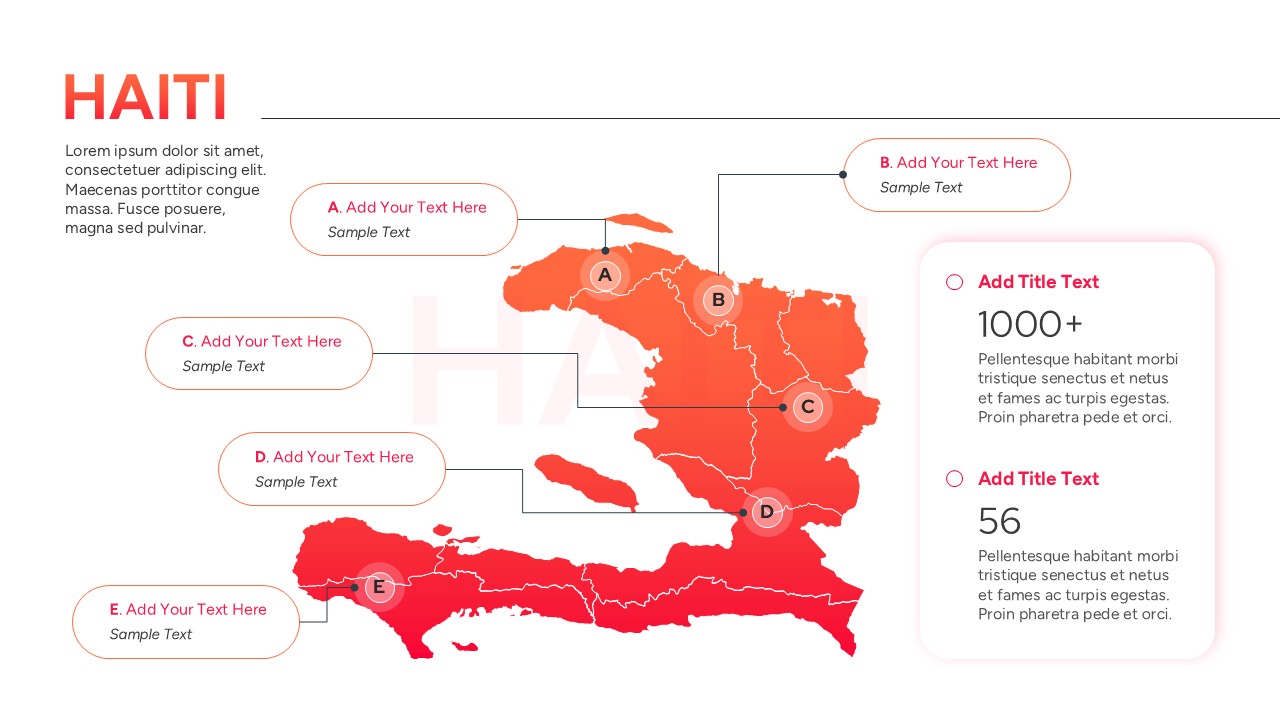
Home Editable Haiti Map Template for PowerPoint & Google Slides Haiti Geography Presentation Slide
Professional Haiti map infographic with red location markers and data callout boxes for regional analysis
Product Highlights
No. of Slides
Category
Compatable With
Rating
0/5
(0 reviews)
Item ID
Author
Tags