Your Cart
0 Assets added
Your cart is empty.
Home Map of Mexico Template for PowerPoint & Google Slides Mexico Regional Percentage Map
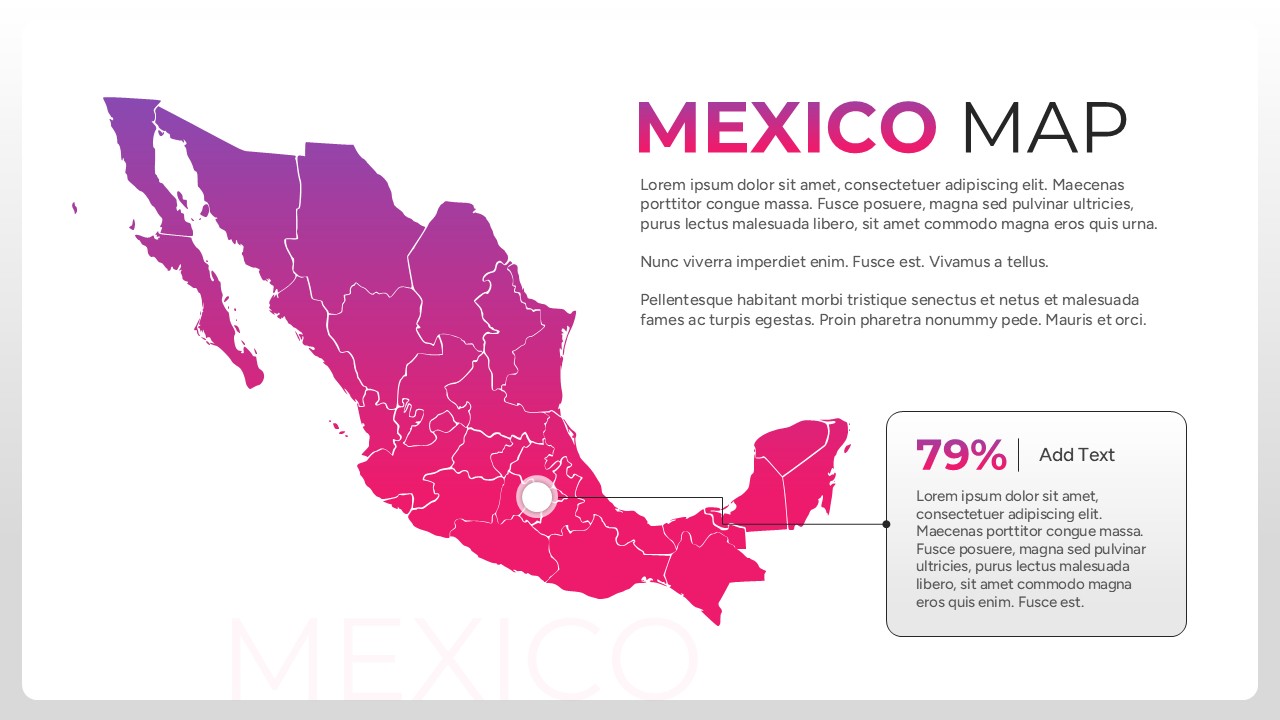
A vibrant pink-to-purple gradient Map of Mexico slide with a 79% data callout box and descriptive text area
Product Highlights
No. of Slides
Category
Compatable With
Rating
0/5
(0 reviews)
Item ID
Author
Tags