Your Cart
0 Assets added
Your cart is empty.
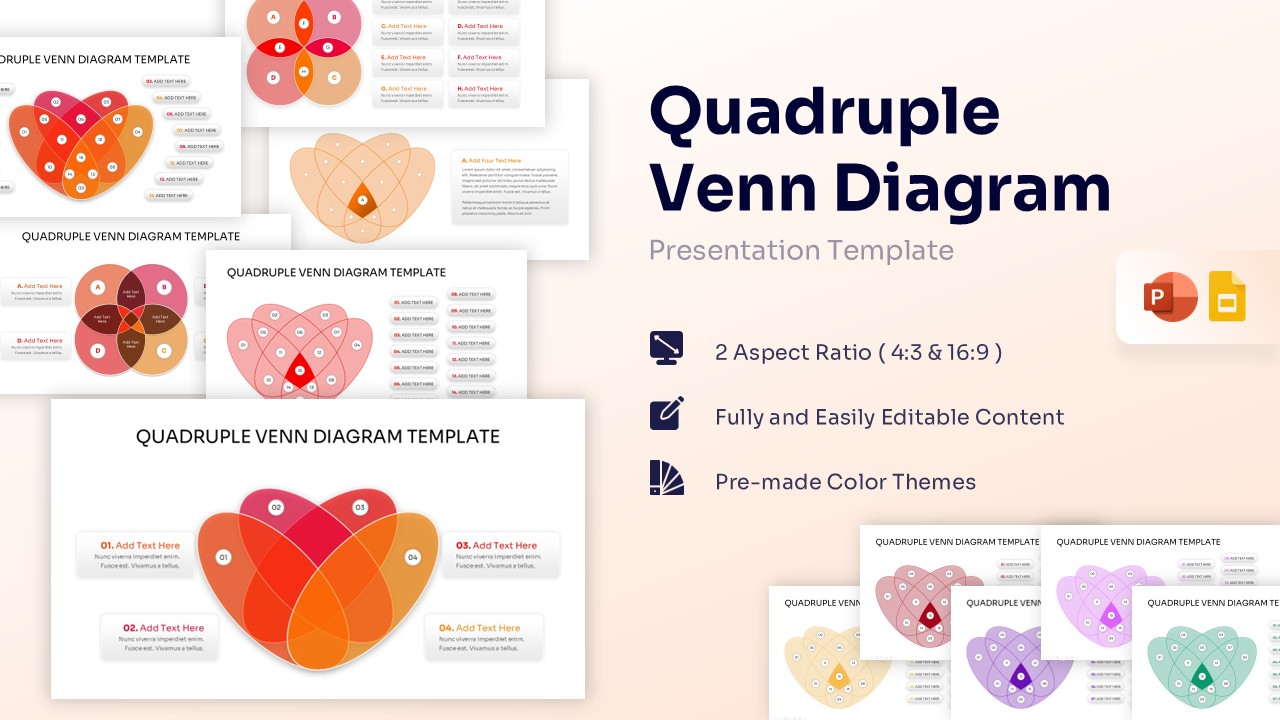
Home Quadruple Venn Diagram Template for PowerPoint & Google Slides Quadruple Venn Diagram Main Showcase
A comprehensive showcase of a Quadruple Venn Diagram template collection featuring various heart-shaped and circular intersection layouts in warm orange, red, and pink tones.
Product Highlights
No. of Slides
Category
Compatable With
Rating
0/5
(0 reviews)
Item ID
Author
Tags