Risk Heat Map Template for PowerPoint & Google Slides
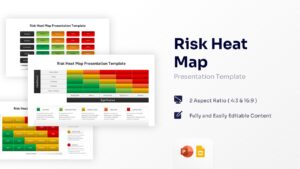


Heat Map Data Visualization Chart Template
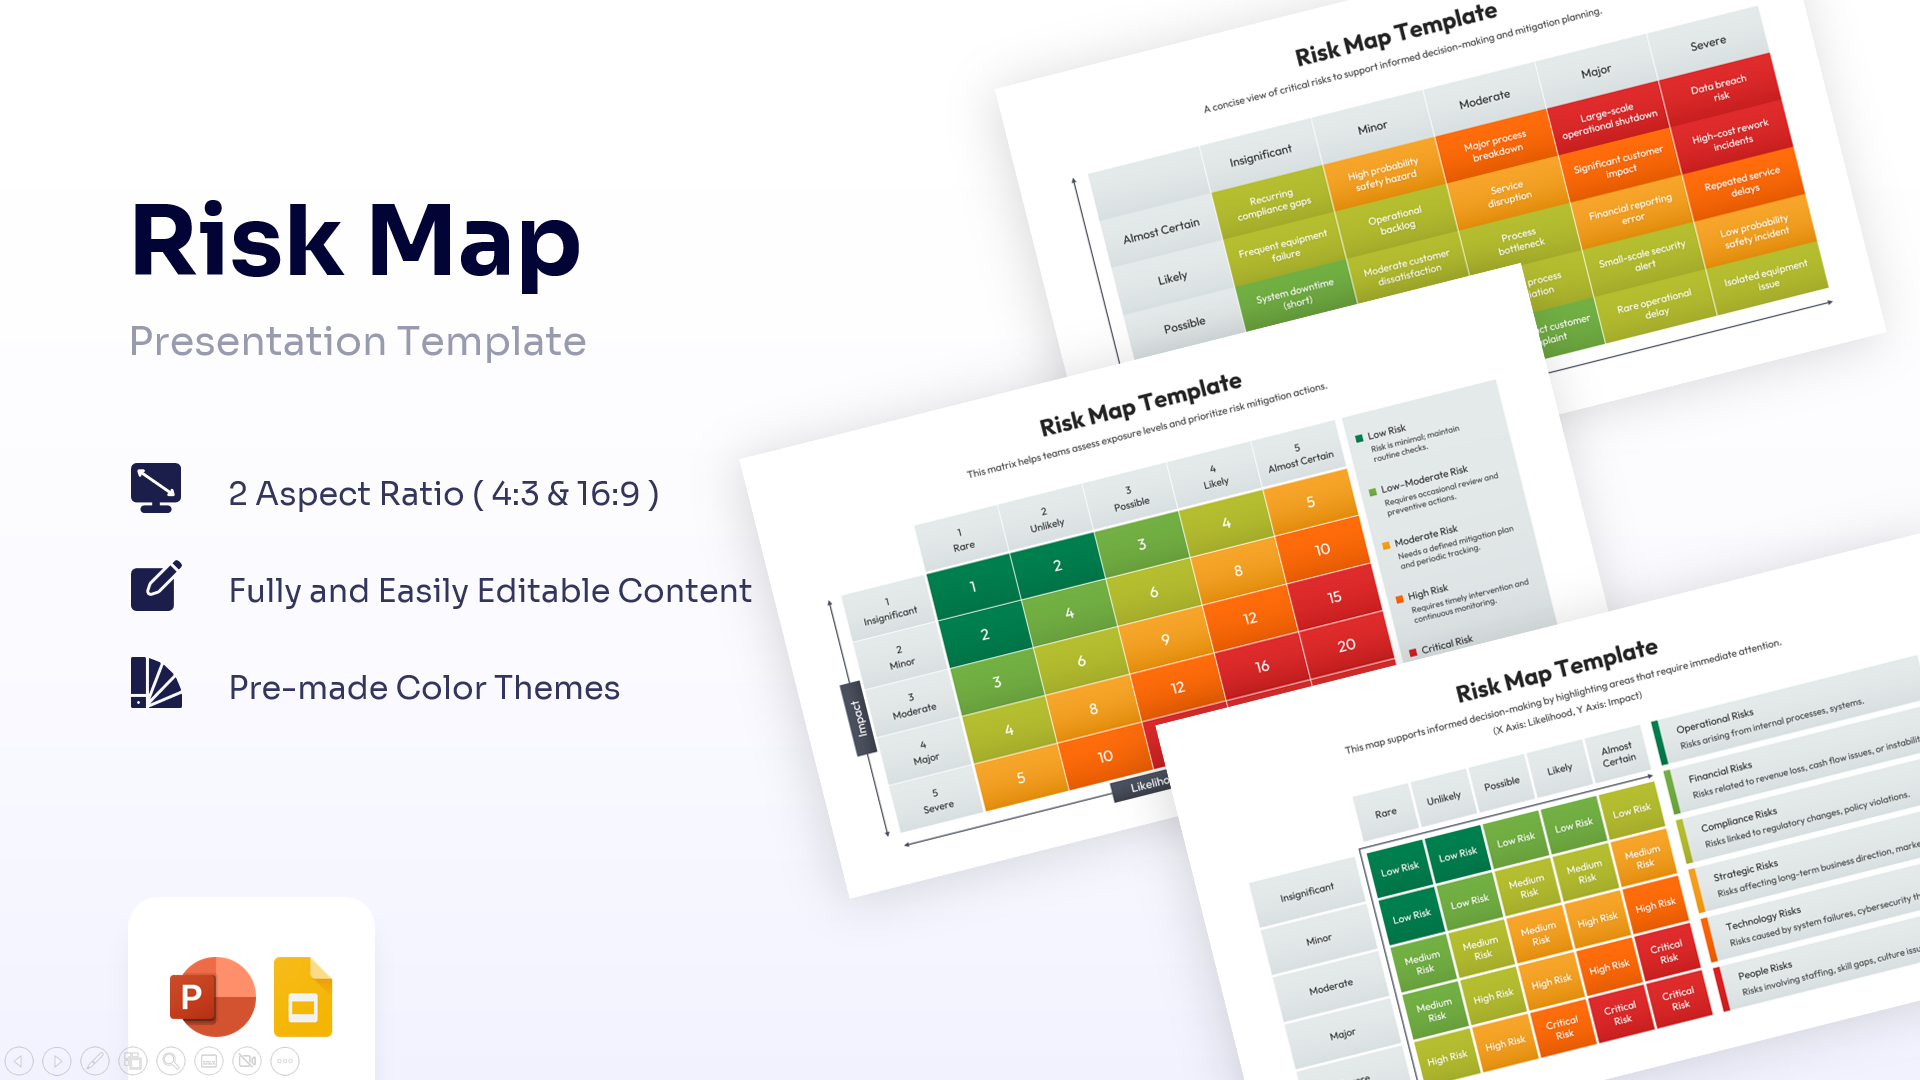
Download this Risk Heat Map Template to identify, evaluate, and prioritize potential organizational threats with a clear visual framework. This professional heatmap template is perfect for risk management briefings where you need to plot the likelihood of an event against its potential impact. By using this heat map, teams can quickly see which risks require immediate executive attention and which can be monitored over time, helping you stay prepared and in control of your project’s success.
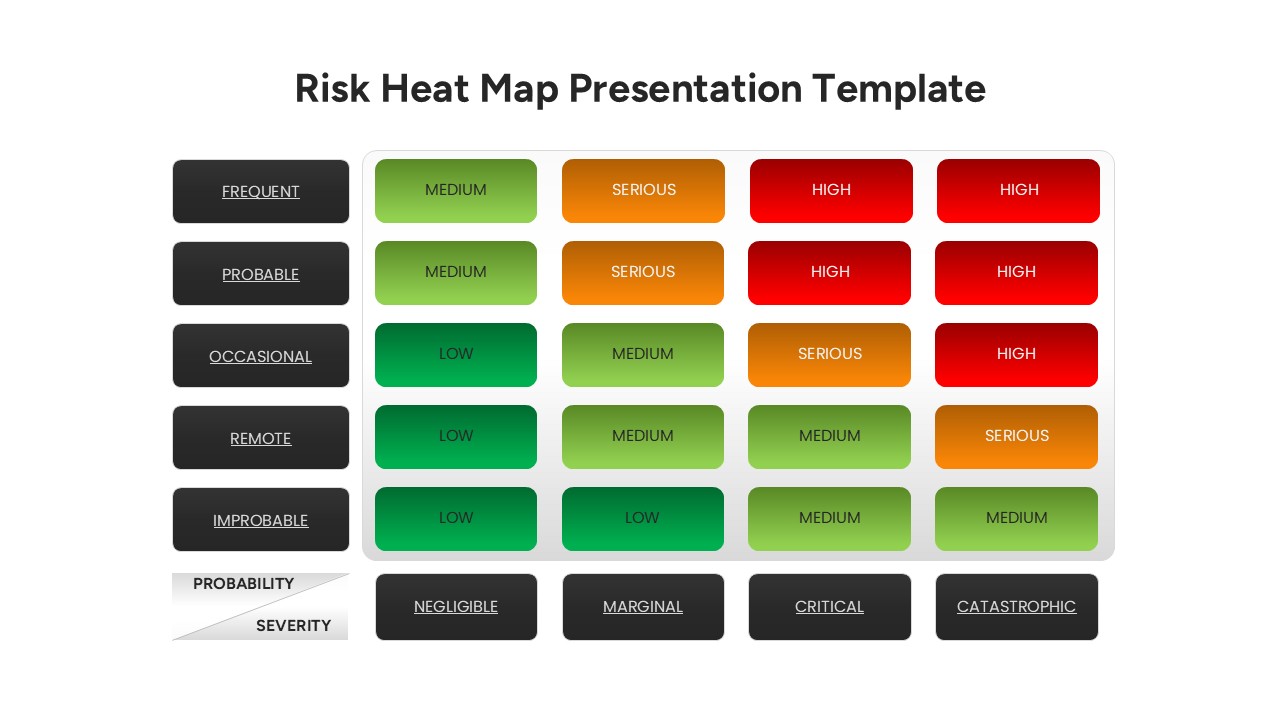
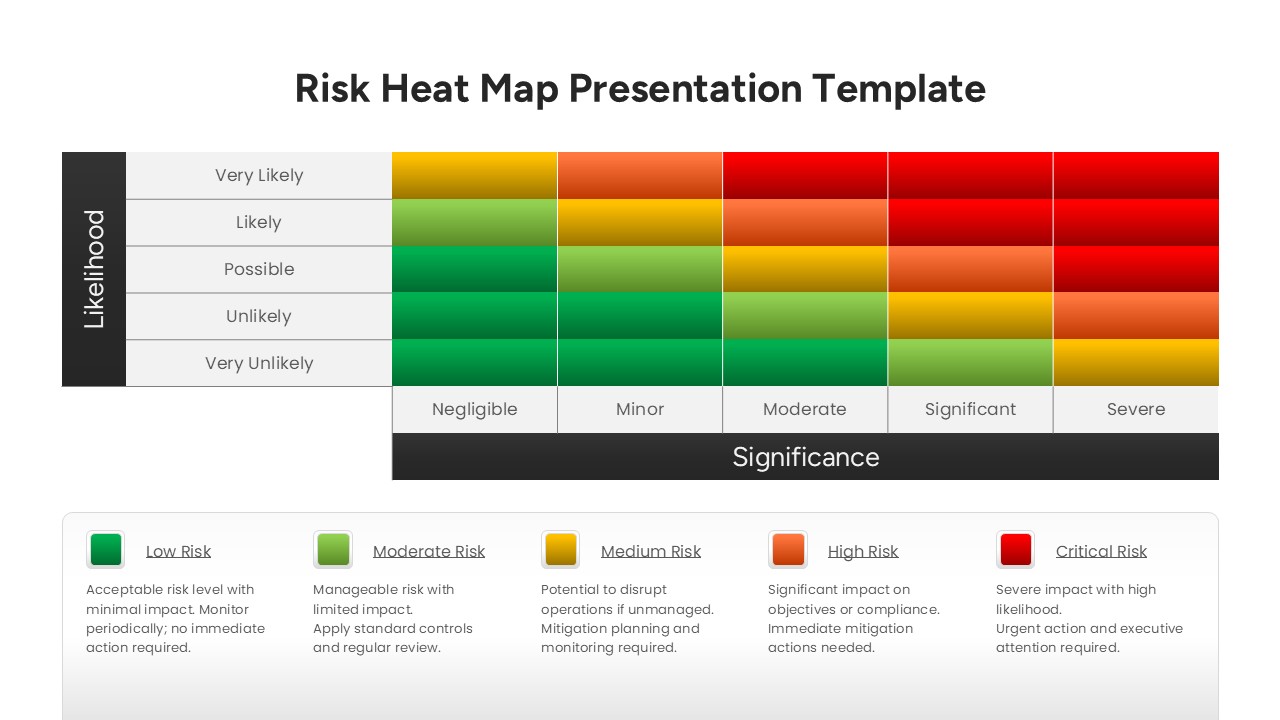
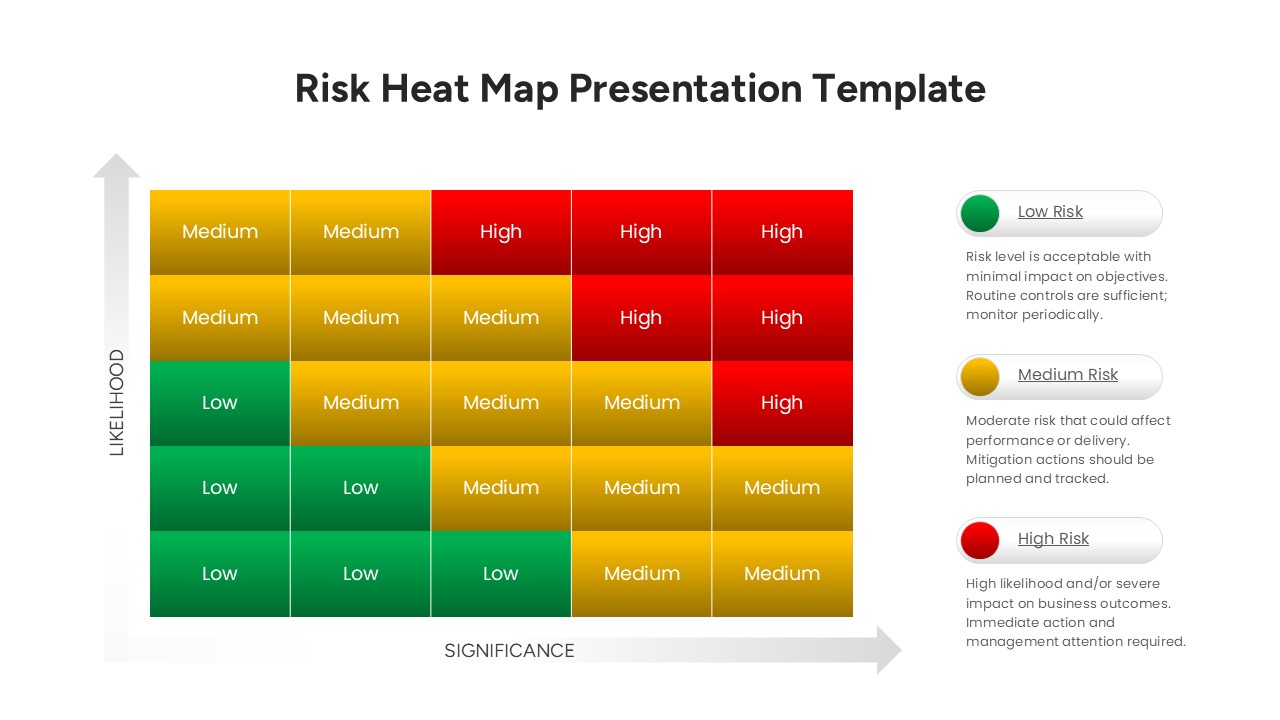
This Risk Heatmap Template features various matrix styles, including a classic 5×5 grid and detailed significance scales. Each slide is designed with a high-contrast color gradient—ranging from green for low-risk zones to vibrant red for critical hazards—ensuring your data is instantly readable. With customizable labels for likelihood (e.g., “Frequent” to “Remote”) and significance (e.g., “Negligible” to “Severe”), you can tailor the assessment to fit your specific industry standards or internal compliance requirements.
Beyond simple risk tracking, these PowerPoint heatmap templates serves as a powerful communication bridge between technical teams and stakeholders. Use them during quarterly business reviews, safety audits, or project kick-offs to align everyone on the current risk landscape. The clean, structured layout reduces the time spent on design, allowing you to focus on developing mitigation strategies. Whether you are managing a small team or a large enterprise, these visuals ensure your strategic planning is both polished and professional.
Who Should Download this Risk Heat Map Template
- Project Managers who need to track and report on project-specific risks during status meetings.
- Compliance Officers and auditors presenting regulatory or safety findings to board members.
- Business Analysts evaluating market volatility or operational weaknesses for strategic reports.
- IT Specialists mapping out cybersecurity threats and system vulnerabilities.
- Consultants helping clients visualize their strategic landscape and mitigation plans.
Why Use this Heat Map Chart
- Provides a structured risk assessment matrix for objective data analysis.
- Includes probability and impact scales that are easy for audiences to interpret.
- Fully editable components allow for customizable risk levels and descriptions.
- Streamlines the mitigation planning process with clear visual cues.
Key Features
- 100% Vector-Based Graphics
- Fully Layered & Organized
- Multi-Platform Support
- Theme Color & Theme Font
Frequently Asked Questions
- What is a Risk Heat Map used for?
- A Risk Heat Map is a visual tool used to represent the results of a risk assessment process. It plots risks on a grid based on their likelihood of occurrence and the severity of their impact, helping organizations prioritize which issues need the most resources.
- Can I change the colors of the risk zones?
- Yes, every element in this template is fully editable. You can easily adjust the theme colors in PowerPoint or Google Slides to match your company\'s branding or specific risk reporting standards.
- Is this template suitable for cybersecurity reporting?
- Absolutely. The matrix format is a standard in cybersecurity for mapping out vulnerabilities and threats, making it an ideal choice for IT security presentations.
Related Templates
-
-
 $3.99
$3.99 -
 $3.99
$3.99 -
 $3.99
$3.99