GE McKinsey Matrix Template for PowerPoint & Google Slides

Comprehensive Business Portfolio Analysis Framework
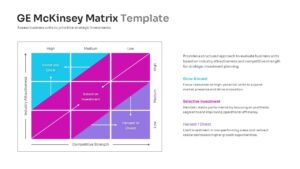
Download this GE McKinsey Matrix Template and use case for strategic planning, resource allocation, or corporate restructuring. This powerful business strategy portfolio model allows leadership teams to visualize their market position with absolute clarity. The slide deck provides a systematic way to categorize different business units based on their long-term potential and current competitive standing.
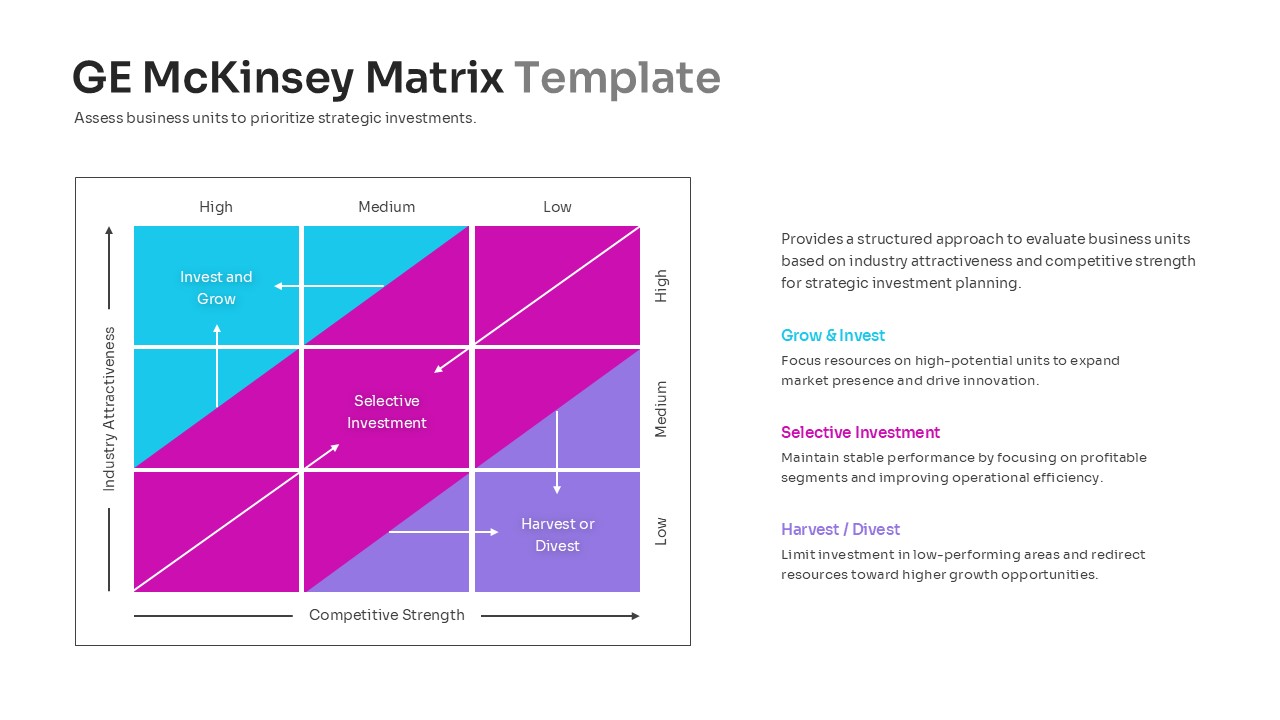
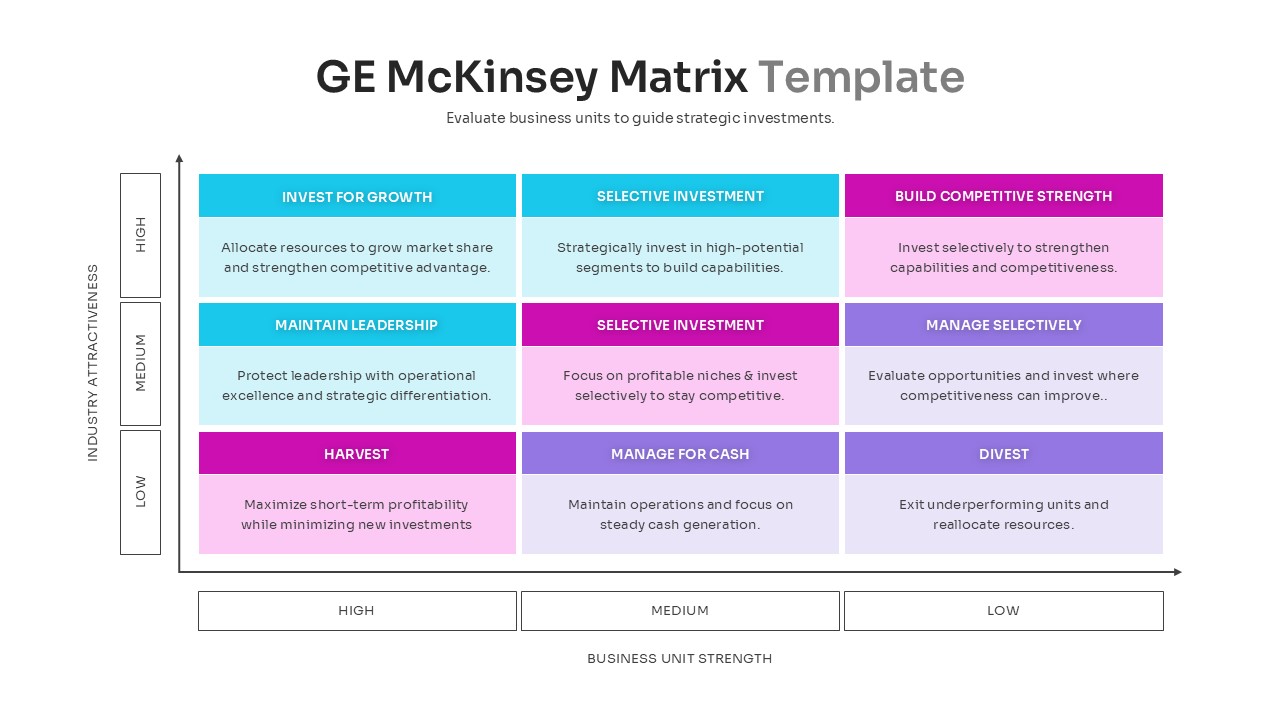
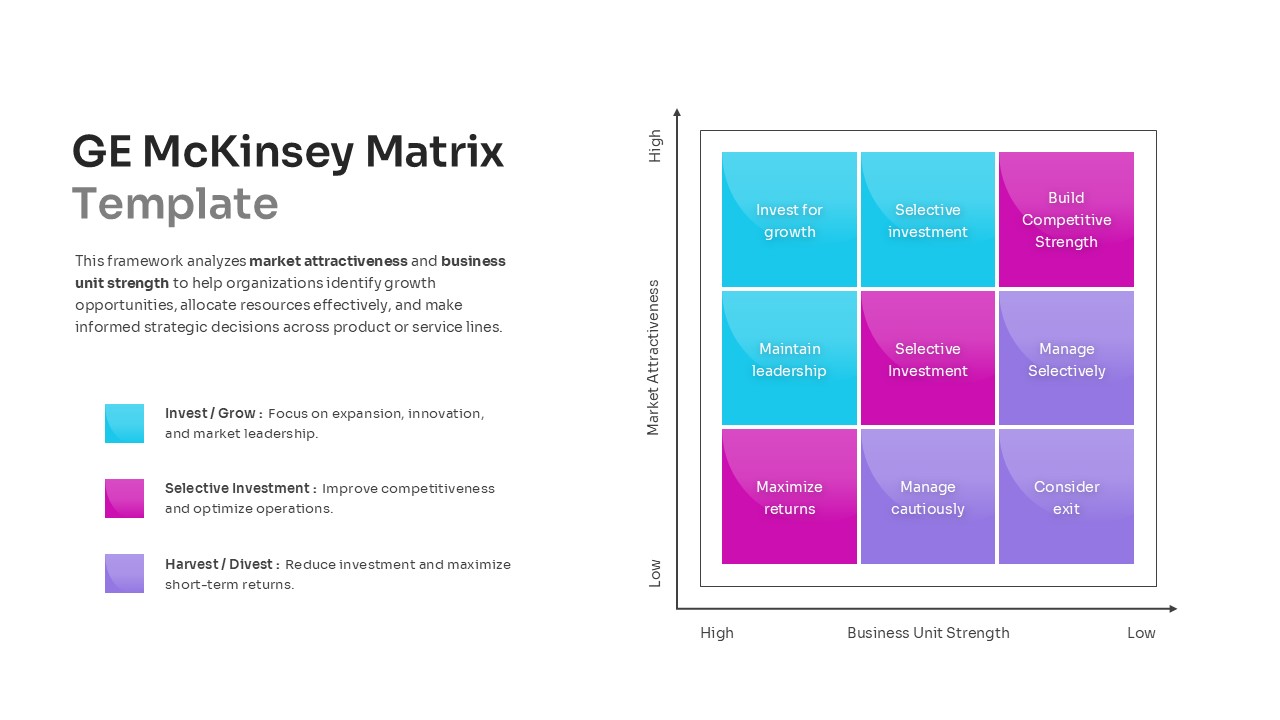
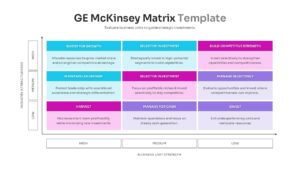
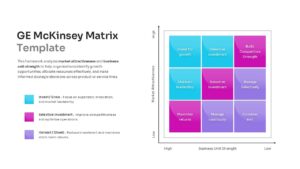
Navigating complex corporate structures requires a reliable 9-box matrix to distinguish between high-growth opportunities and underperforming segments. These GE McKinsey Matrix Chart offers multiple layouts, including detailed descriptions for “Invest and Grow,” “Selective Investment,” and “Harvest/Divest” strategies. By utilizing this presentation layout, consultants and managers can justify budgetary shifts and highlight which divisions require immediate capital infusion or operational optimization.
Every element is a high-quality vector graphic, ensuring that you can resize or recolor any section without losing resolution. This visual framework is designed for maximum flexibility, allowing you to adapt the axes and labels to fit your specific industry needs. You can easily integrate these editable strategic planning diagrams into existing corporate reports to create a cohesive and professional narrative for your stakeholders.
Why Use these 9-Box Matrix Slides – Strategic Business Unit Evaluation
- Provides a structured approach to evaluate business units based on industry attractiveness and competitive strength.
- Reduces preparation time by using pre-designed layouts for complex strategic modeling.
- Ensures a professional aesthetic with consistent color-coded zones for growth, stability, and exit.
- Enhances audience retention by transforming abstract data into a clear, actionable 2D grid.
Who Should Download this GE McKinsey Matrix – Industry Attractiveness Grid
- Corporate Strategists and Business Development Managers assessing market entry or exit.
- Management Consultants providing portfolio recommendations to C-suite executives.
- MBA Students and Business Educators teaching frameworks for organizational growth.
- Venture Capitalists and Investment Analysts evaluating the health of diversified holdings.
Key Features
- 100% Vector-Based Graphics
- Fully Layered & Organized
- Multi-Platform Support
- Theme Color & Theme Font
- Detailed 9-box categorization descriptions
- High-contrast strategic zone coloring
Frequently Asked Questions
- How do I add my own data to the GE McKinsey Matrix variation?
- Each cell and text box is fully editable; simply click on the placeholder text or shapes in PowerPoint or Google Slides to input your specific business unit data.
- Is the 9-Box Matrix layout customizable for different industries?
- Yes, you can modify the labels on the Industry Attractiveness and Business Unit Strength axes to better reflect the unique KPIs of your specific market.
- Can I change the colors of the strategic zones?
- Absolutely, all shapes are vector-based, allowing you to change fill colors to match your brand identity or specific performance heat maps.
Related Templates
-
 $4.99
$4.99 -
-
-