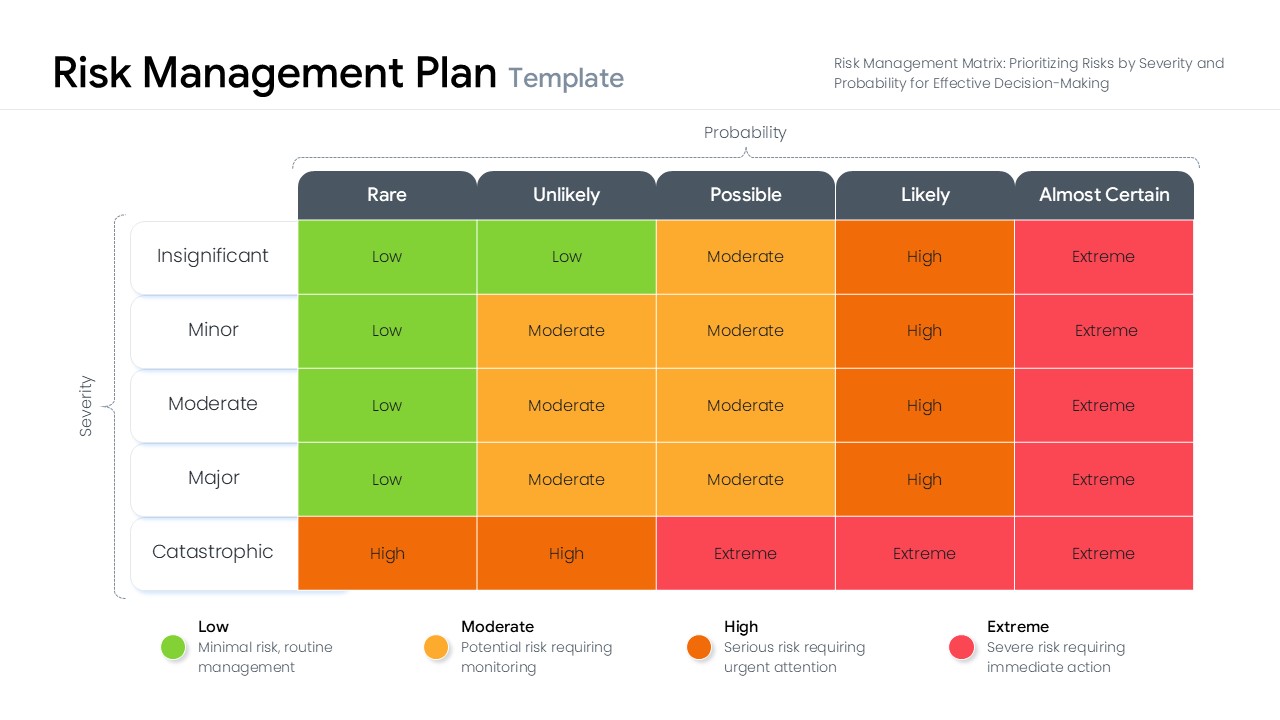
5×5 Heatmap Matrix Template
This heatmap provides a visual representation of risk levels ranging from Low to Extreme based on the likelihood of occurrence. The vertical axis measures severity while the horizontal axis tracks probability, offering a classic risk assessment matrix format. It is ideal for high-level summaries where stakeholders need to see the distribution of risks at a glance.