Cladogram Template for PowerPoint & Google Slides


Comprehensive Evolutionary Tree Diagram
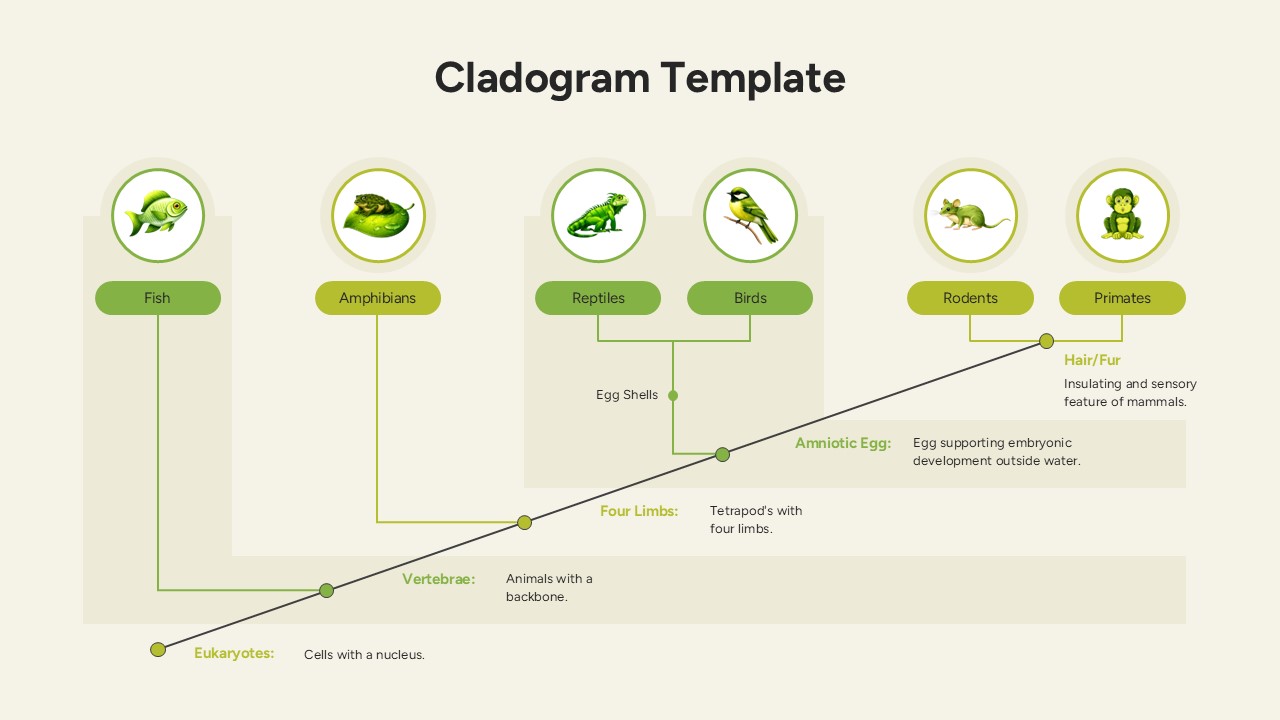
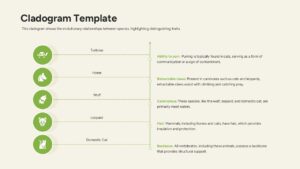
Download this Cladogram and use case for biology lectures, genomic research presentations, or educational workshops. High-quality biological classification slides for students help simplify the complex history of life on Earth. This resource provides a clear visual path for tracing shared characteristics across different species and genera.
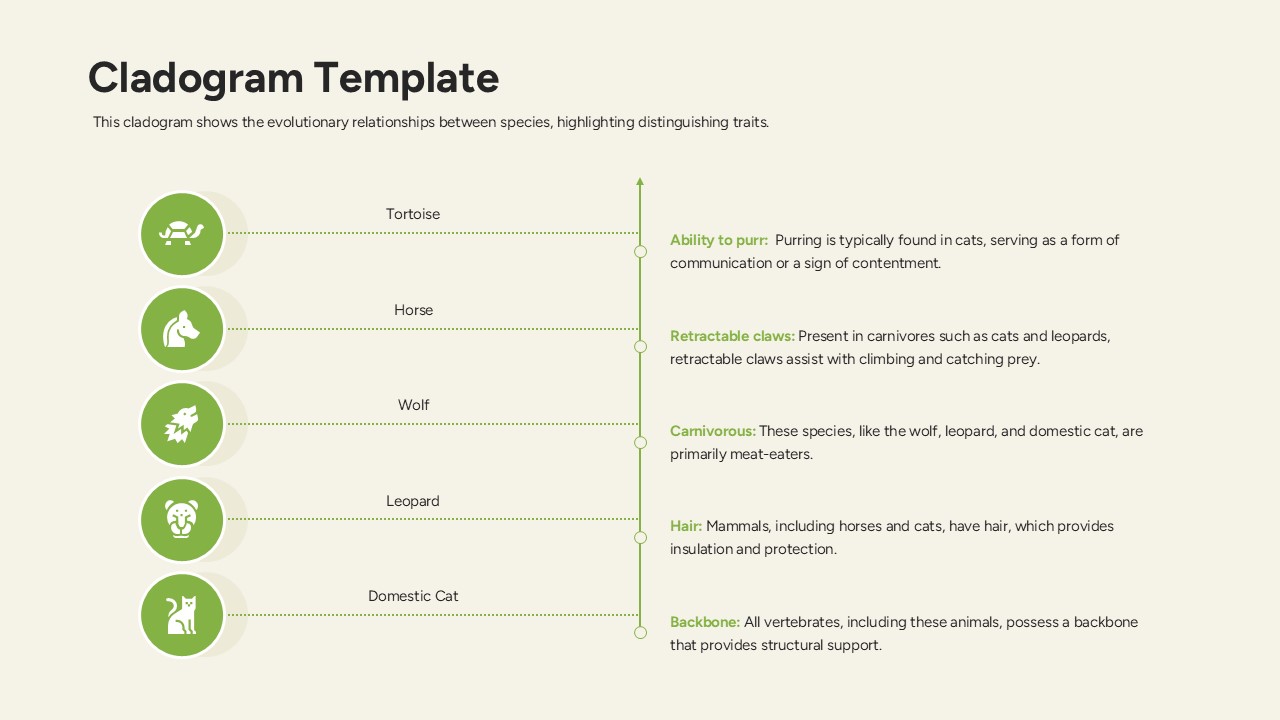
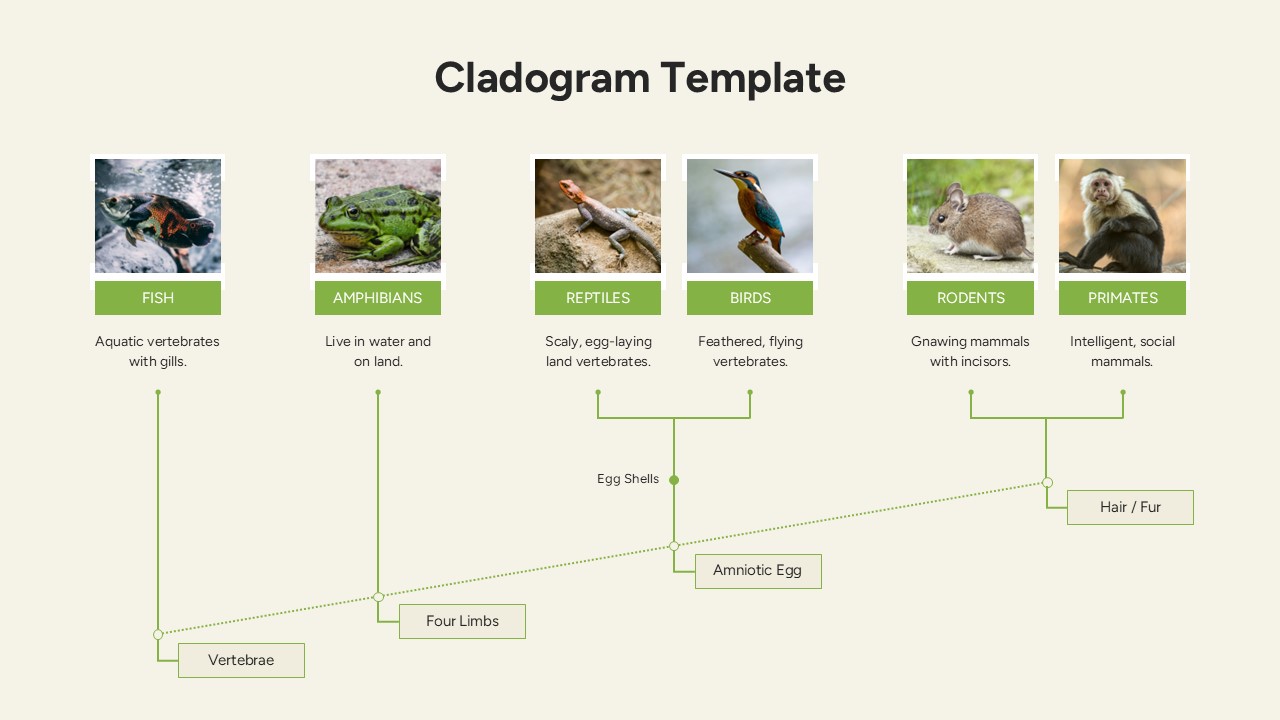
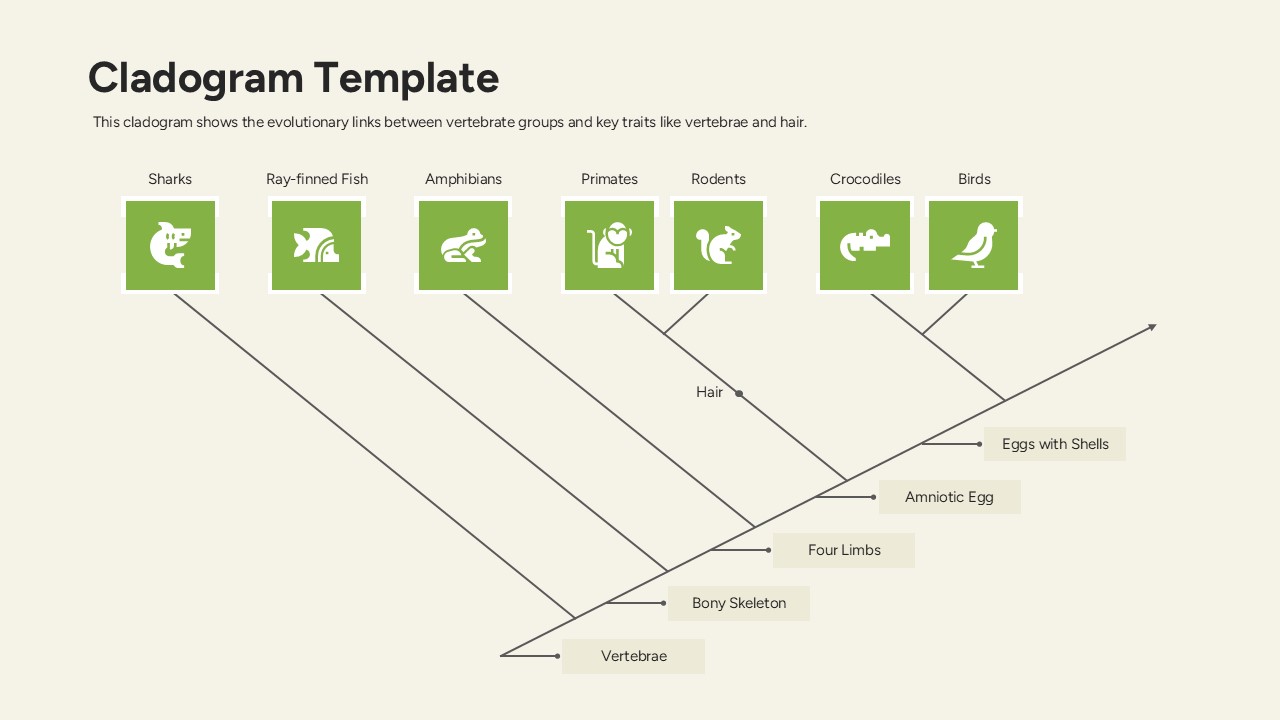
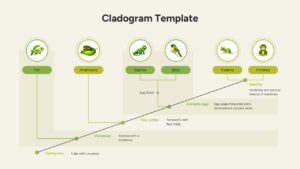
This Cladogram diagram template allows researchers and educators to demonstrate the branching patterns of evolution with precision. Using this presentation layout, you can highlight specific nodes where common ancestors diverged into distinct groups, such as the transition from aquatic to terrestrial life. These infographic slides are perfect for explaining cladistics, taxonomy, and the development of unique traits like the amniotic egg or fur.
Every element in this visual framework is a high-definition vector, ensuring that your data remains crisp even when projected on large auditorium screens. This slide deck is built for total flexibility, allowing users to move branches or adjust labels to fit their specific scientific narrative. You can also explore our science and nature diagram collections to find complementary graphics for your environmental or medical presentations.
Why Use this Cladogram Template – Biological Classification Slides
- Simplifies complex evolutionary data into an easy-to-follow branching structure.
- Enhances student engagement through professional-grade biological illustrations.
- Saves hours of design time with pre-built layouts for vertebrate and mammalian lineages.
- Ensures scientific accuracy with dedicated sections for derived traits and ancestral characteristics.
Who Should Download this Vertebrate Evolution Chart – Evolutionary Tree Diagram
- Biology Professors and University Lecturers teaching genetics or zoology.
- High School Science Teachers looking for clear classroom visuals.
- Museum Curators designing educational exhibits on natural history.
- Research Scientists presenting findings at evolutionary biology conferences.
Key Features
- 100% Vector-Based Graphics
- Fully Layered & Organized
- Multi-Platform Support
- Theme Color & Theme Font
- Editable Nodes and Branching Points
- Detailed Species Icons and Photography Placeholders
Frequently Asked Questions
- Can I add more branches to the Cladogram?
- Yes, the entire branching structure is made of editable vector lines, allowing you to add or remove species lineages as needed.
- Is the text in the evolutionary tree diagram fully editable?
- Absolutely, every label, trait description, and species name can be customized using standard text tools in PowerPoint or Google Slides.
- Can I change the icons in the biological classification slides?
- Yes, the icons are separate layers that can be replaced with your own images or different vector symbols to match your specific study.
Related Templates
-
-
 $3.99
$3.99 -
 $3.99
$3.99 -
 $3.99
$3.99