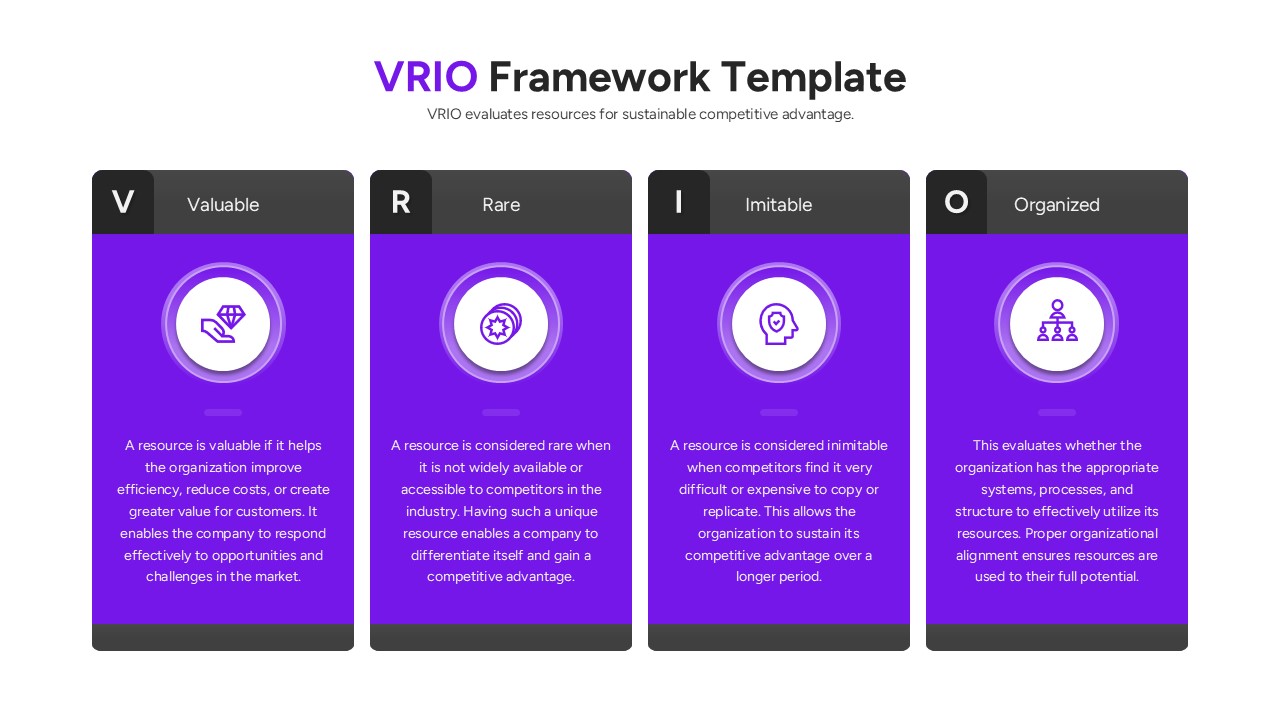
This slide illustrates the logical progression of a VRIO analysis from left to right. It uses circular icons and “Yes/No” paths to determine the level of competitive advantage provided by a specific resource. The layout is clean and helps viewers follow the decision-making process easily.