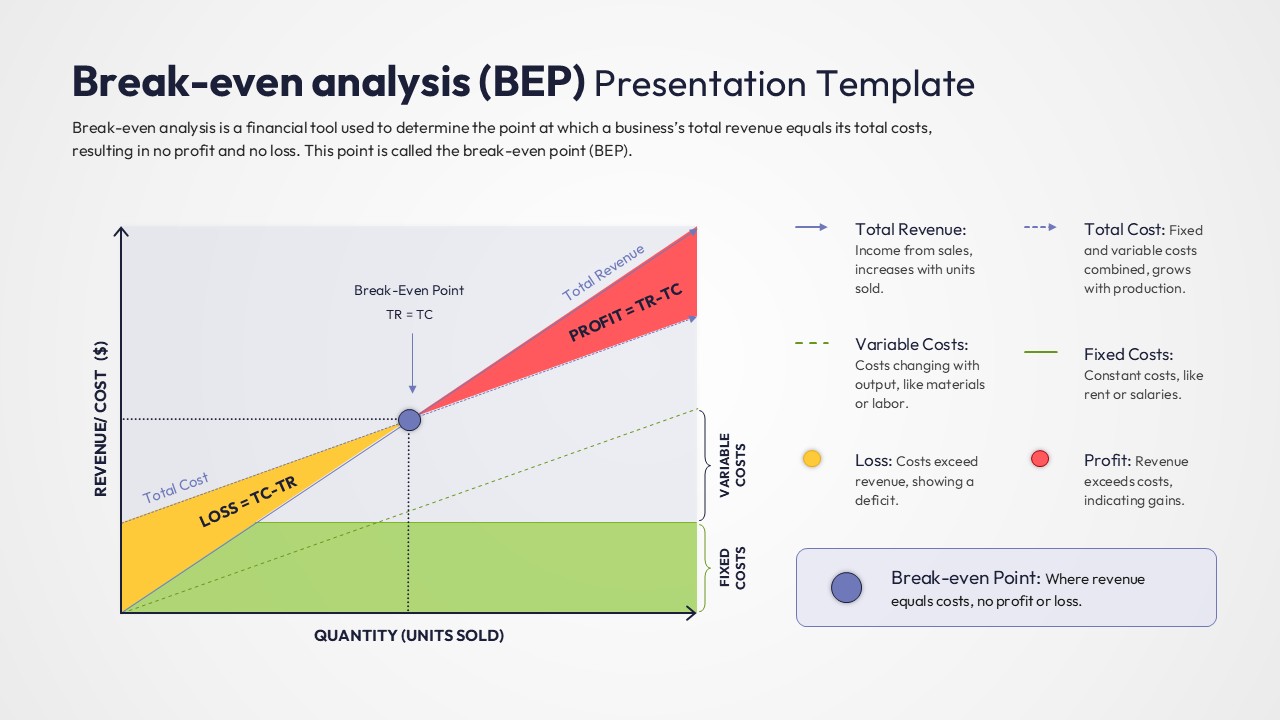
This slide focuses on the individual components of the break-even model by providing a detailed legend for every line and area on the graph. It helps the audience distinguish between different cost drivers and revenue streams. The clean design ensures that the data remains the focal point of the presentation.