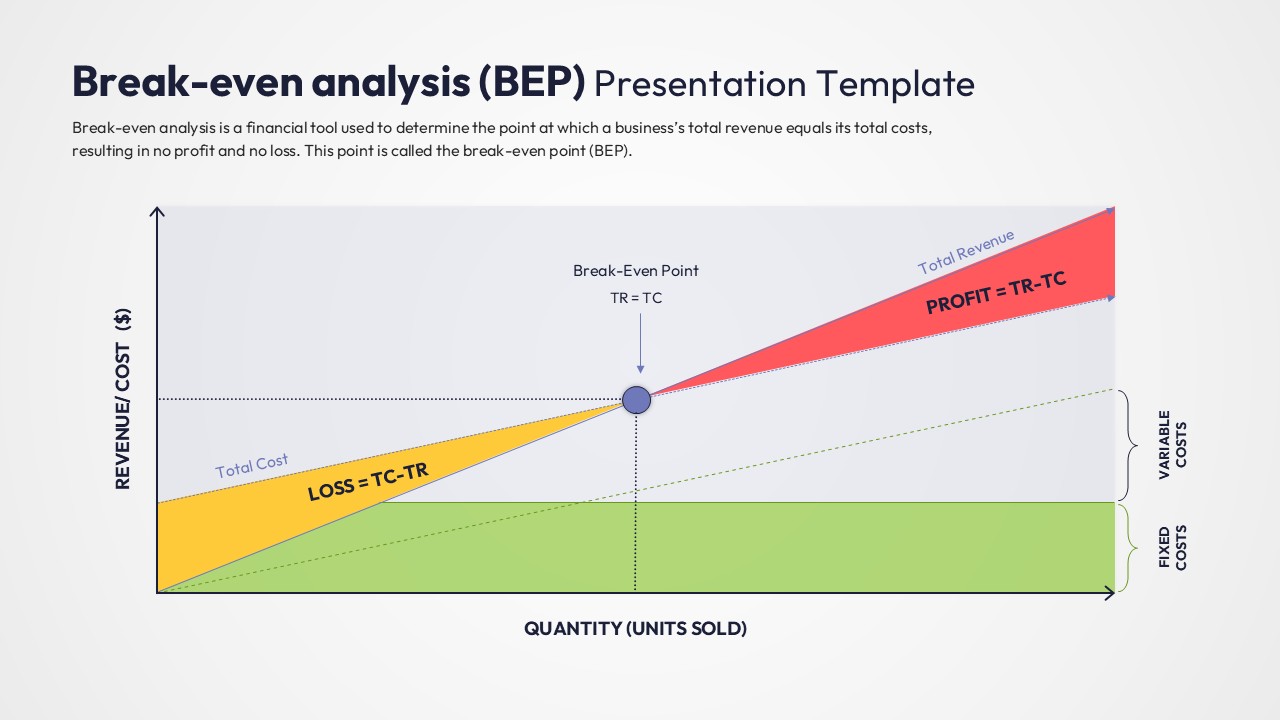
This slide features a classic break-even chart where the X-axis represents quantity and the Y-axis represents revenue/cost. It clearly identifies the loss zone in yellow and the profit zone in red, with a distinct marker for the break-even point. This visual is ideal for explaining the relationship between sales volume and profitability.