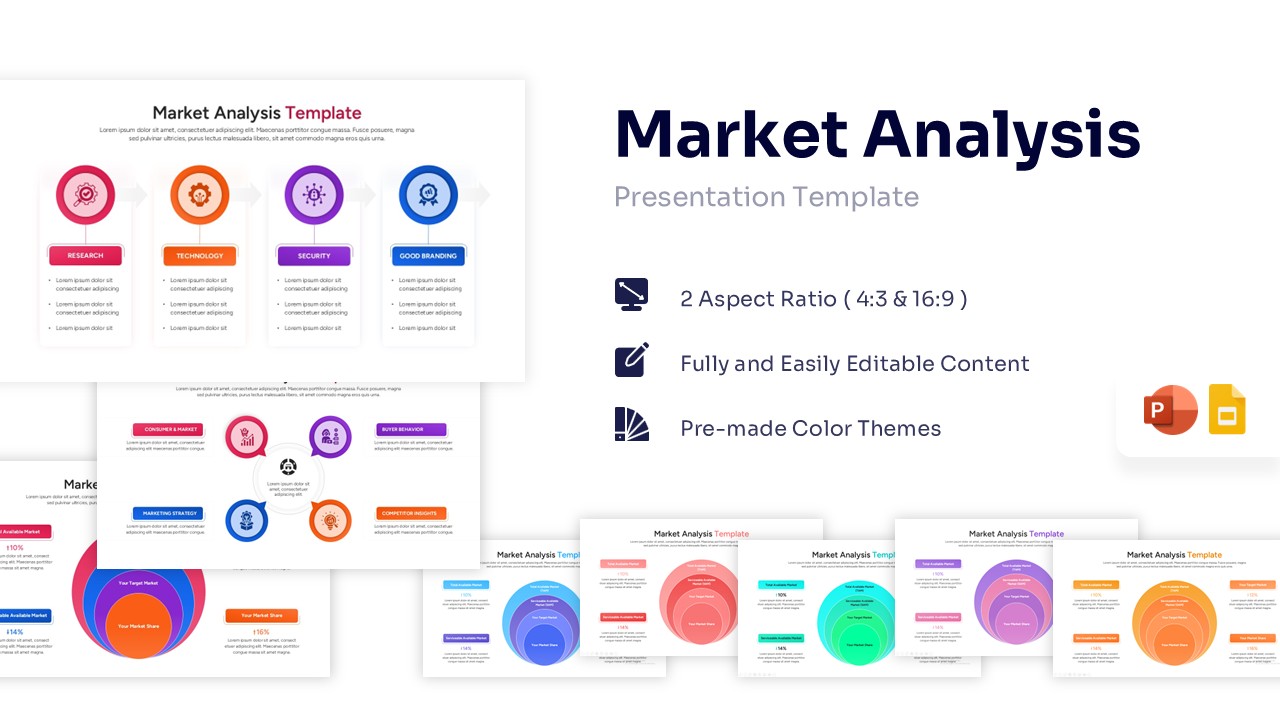
Brand Value Chain Template for PowerPoint & Google Slides
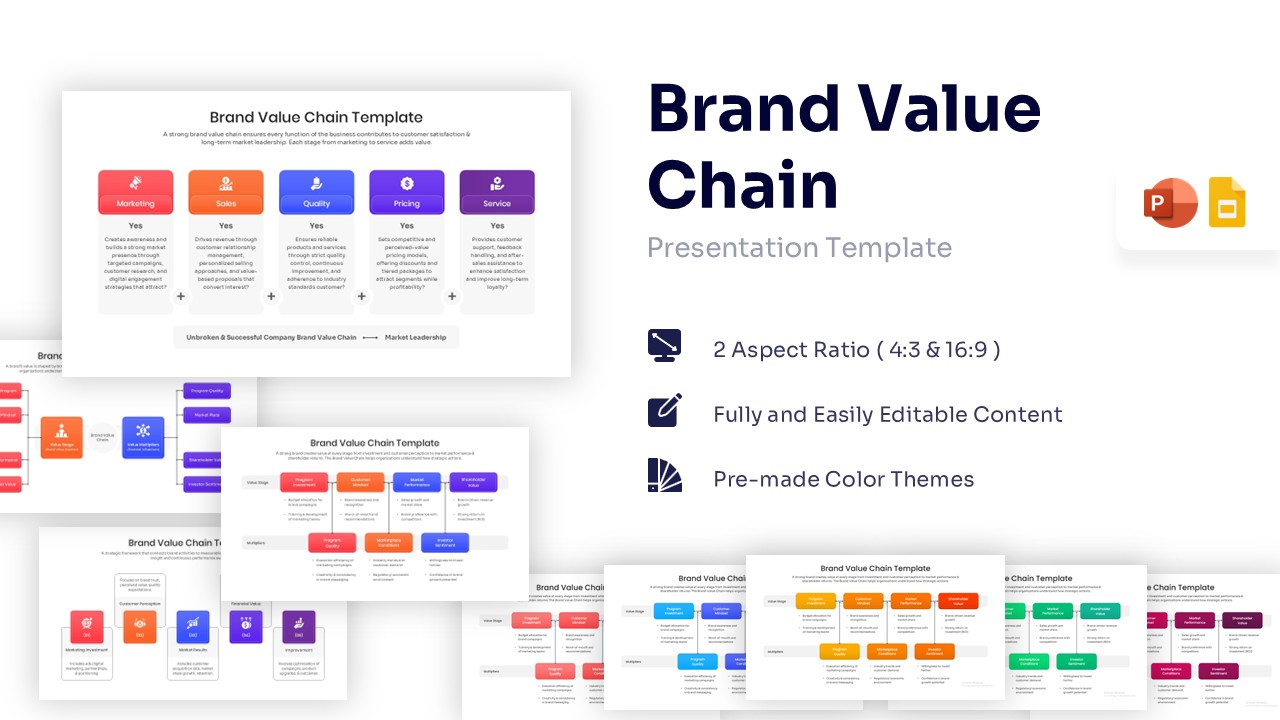


Strategic Brand Value Chain Presentation Template
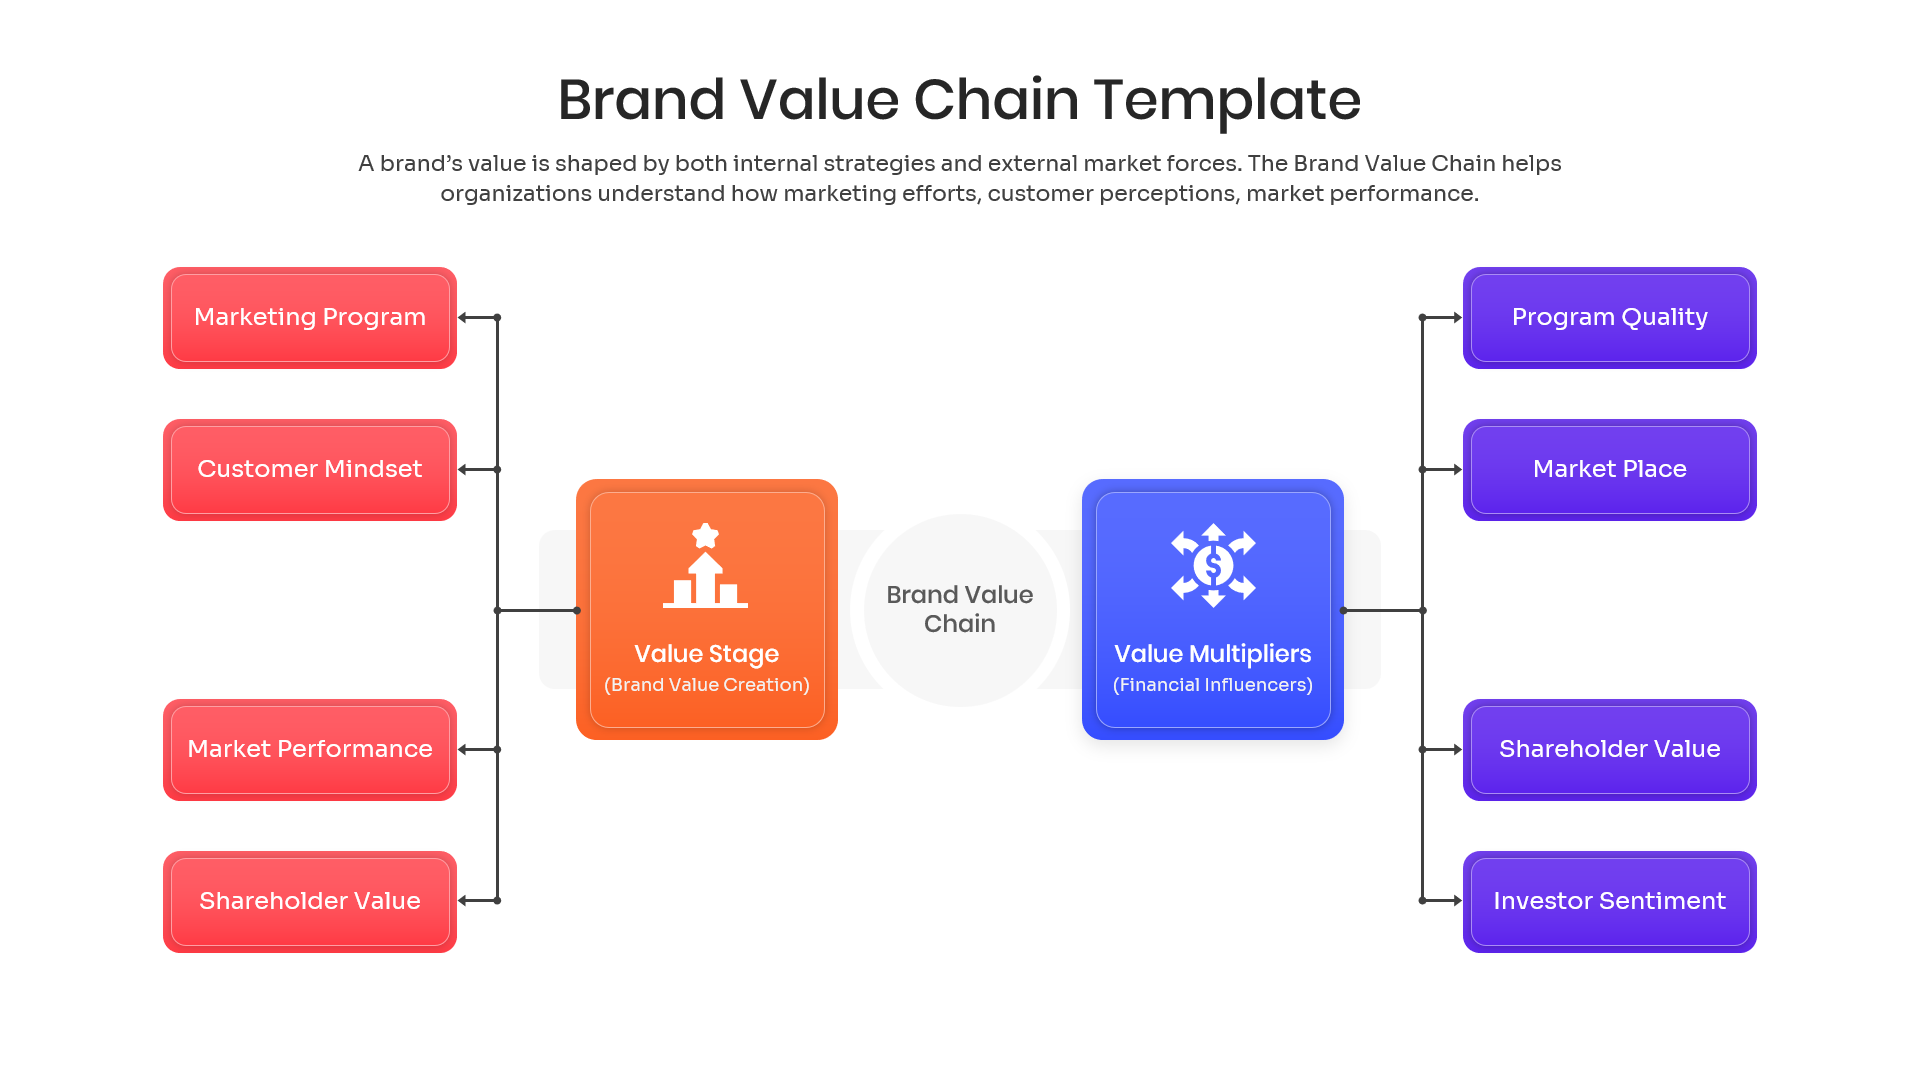
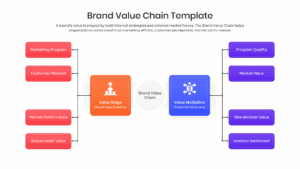
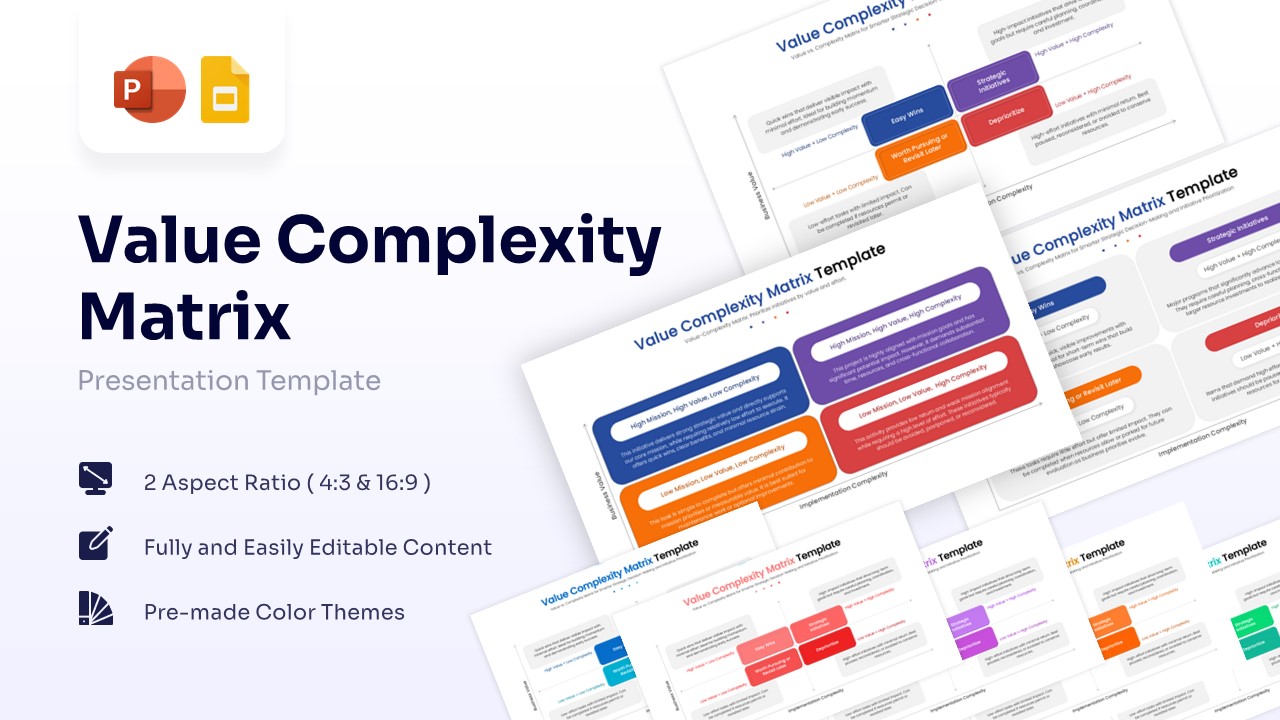
Download this Brand Value Chain template to clearly visualize how your marketing activities translate into real business results. A strong Brand Value Chain is essential for showing stakeholders the direct link between marketing investment, customer perception, and long-term shareholder value. This business analysis infographic template helps you present that story effectively without starting from scratch.
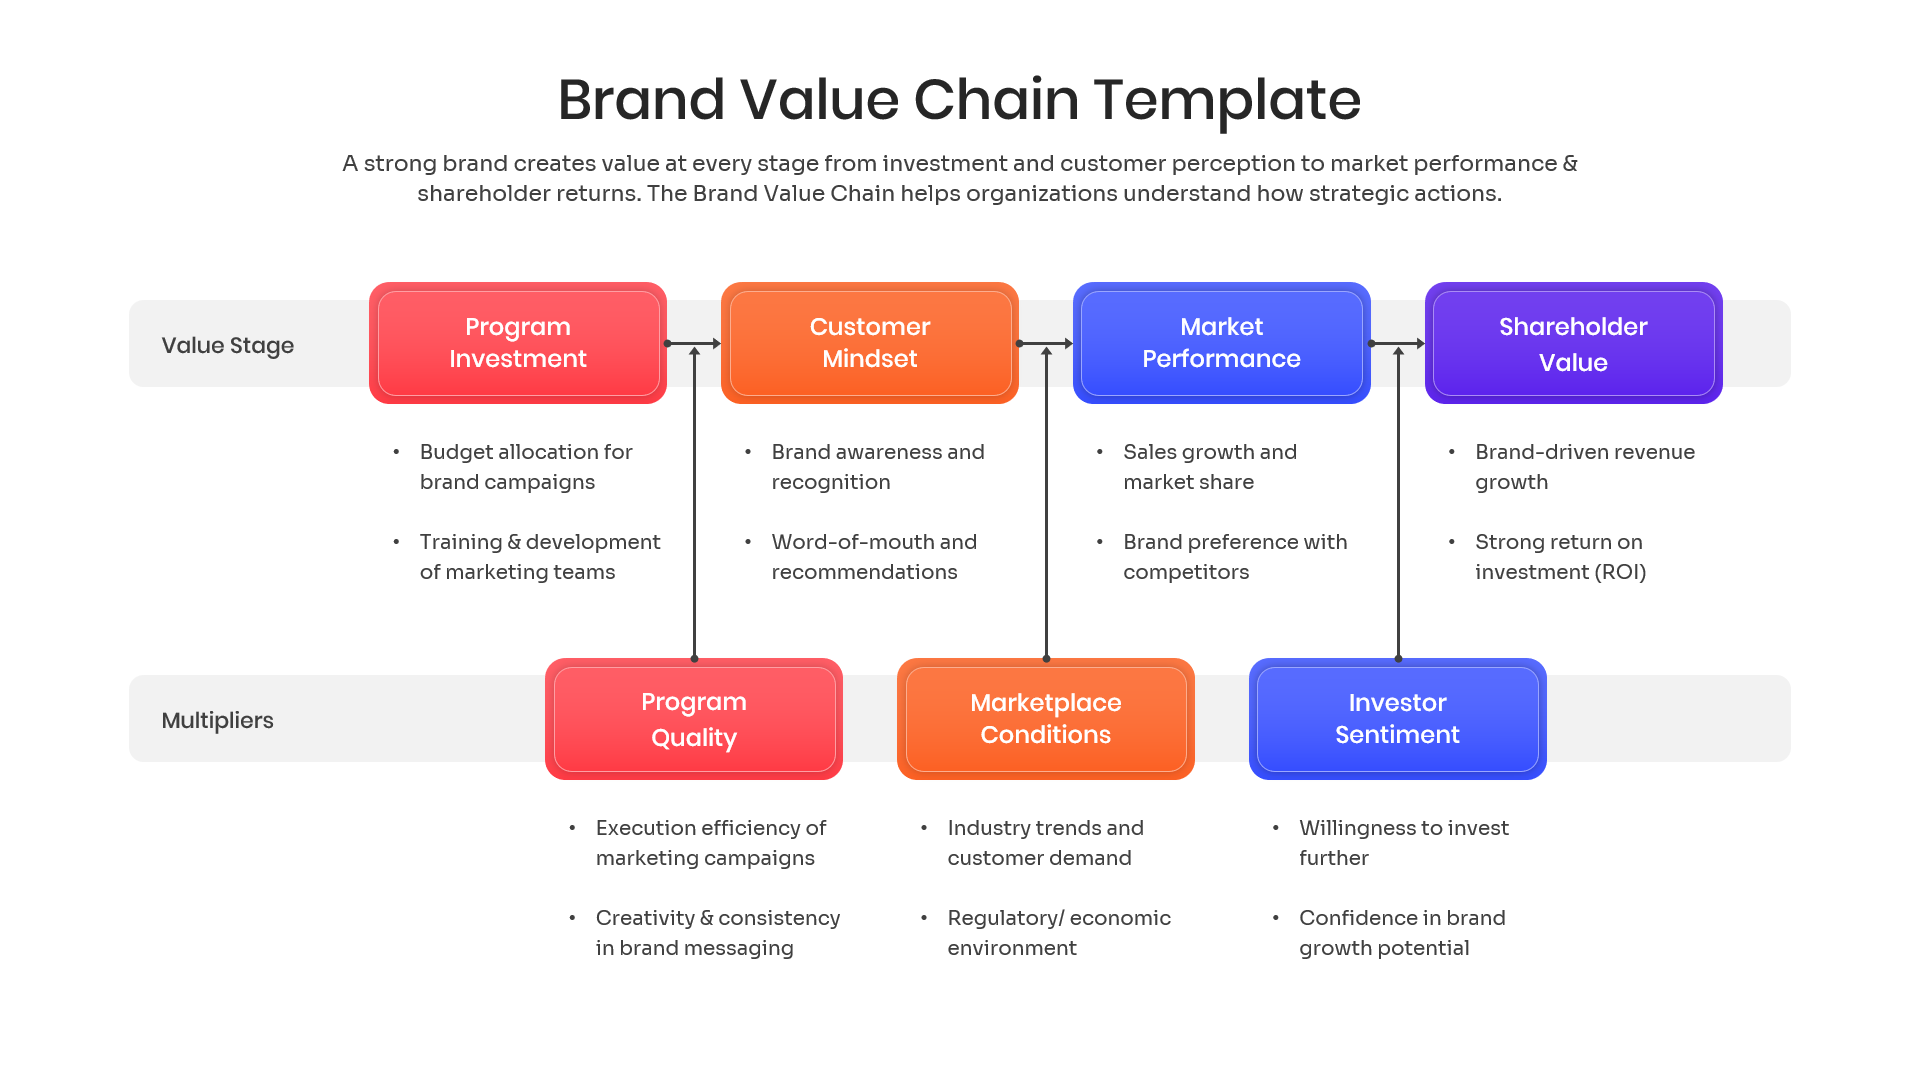
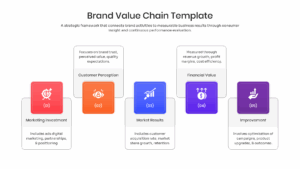
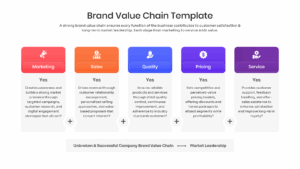
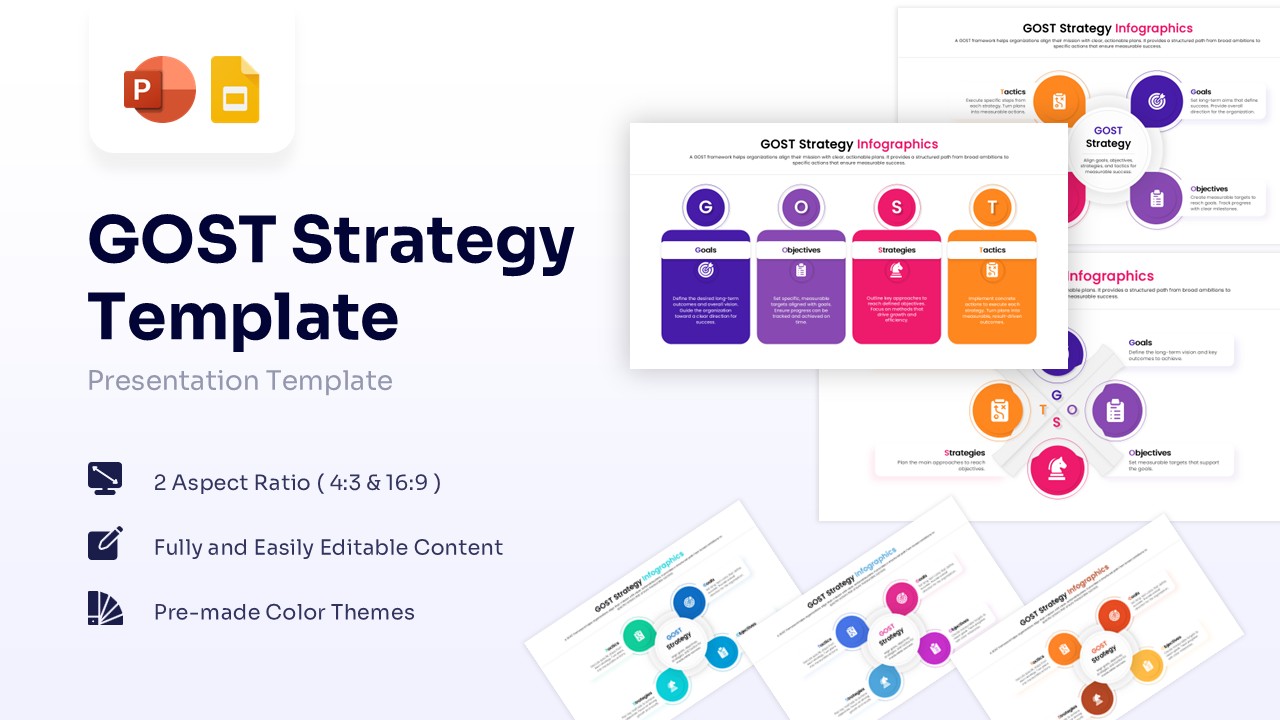
This brand value chain infographics features a variety of professional layouts designed to map out the brand equity process. It covers key stages such as Program Investment, Customer Mindset, Market Performance, and Financial Value, along with the necessary multipliers like Program Quality and Investor Sentiment. The slides utilize a clean, multi-color design—using distinct shades for different stages—paired with clear icons (like megaphones for marketing and graphs for sales) to make complex strategic models easy to scan and understand. Everything is fully editable, so you can adjust the text, colors, and steps to match your specific business model.
Use business strategy Google slides during quarterly business reviews, brand strategy workshops, or investor updates. They are perfect for demonstrating how intangible assets like “brand awareness” convert into tangible market leadership and revenue growth. Whether you are explaining the Keller model or your own custom framework, this tool ensures your message is polished and professional.
Why Use this Brand Value Chain Infographic Template
- Visualizes the connection between marketing spend and financial return clearly.
- Helps align teams on how brand equity contributes to market leadership.
- Saves hours of design time with pre-built, structured models.
- Makes complex theoretical frameworks easy for any audience to digest.
Who Should Download this Brand Value Chain Process Diagram
- Brand Managers and Marketing Directors tracking performance.
- Business Strategists and Consultants presenting value frameworks.
- Financial Analysts assessing intangible brand assets.
- Executives looking for clear data visualization for board meetings.
Key Features
- 100% Vector-Based Graphics
- Fully Layered & Organized
- Multi-Platform Support
- Theme Color & Theme Font
- Two Aspect Ratios (4:3 & 16:9)
Frequently Asked Questions
- What is a Brand Value Chain?
- It is a strategic framework that traces the value creation process from the initial marketing investment through to customer perception and finally to shareholder value.
- Can I customize the icons?
- Yes, all icons and shapes are vector-based, meaning you can resize, recolor, or replace them easily within PowerPoint or Google Slides.
- Does this support Google Slides?
- Absolutely. This template is designed to work seamlessly in both Microsoft PowerPoint and Google Slides.
Related Templates
-
 $2.99
$2.99 -
-
 $3.99
$3.99 -