Table of Contents
- Defining the Customer Journey Map: The “Visual Story” of Your User
- What is Customer Journey Map? What is Meant by Customer Journey Mapping?
- The 5 Essential Elements to Build a Customer Journey Map
- 3 Types of Customer Journey Maps (And When to Use Them)
- How to Create a Customer Journey Map? Customer Journey Mapping Process
- Why Use a Customer Journey Maps?
- Best Customer Journey Map Example for Your Next Presentation ( Customer Journey Mapping Tools)
- 1. Customer Journey Stages Map
- 5 Proven Ways to Improve Customer Experience
- Customer Journey Map vs. Sales Funnel: What’s the Difference?
- Conclusion: Turn Insights into Action
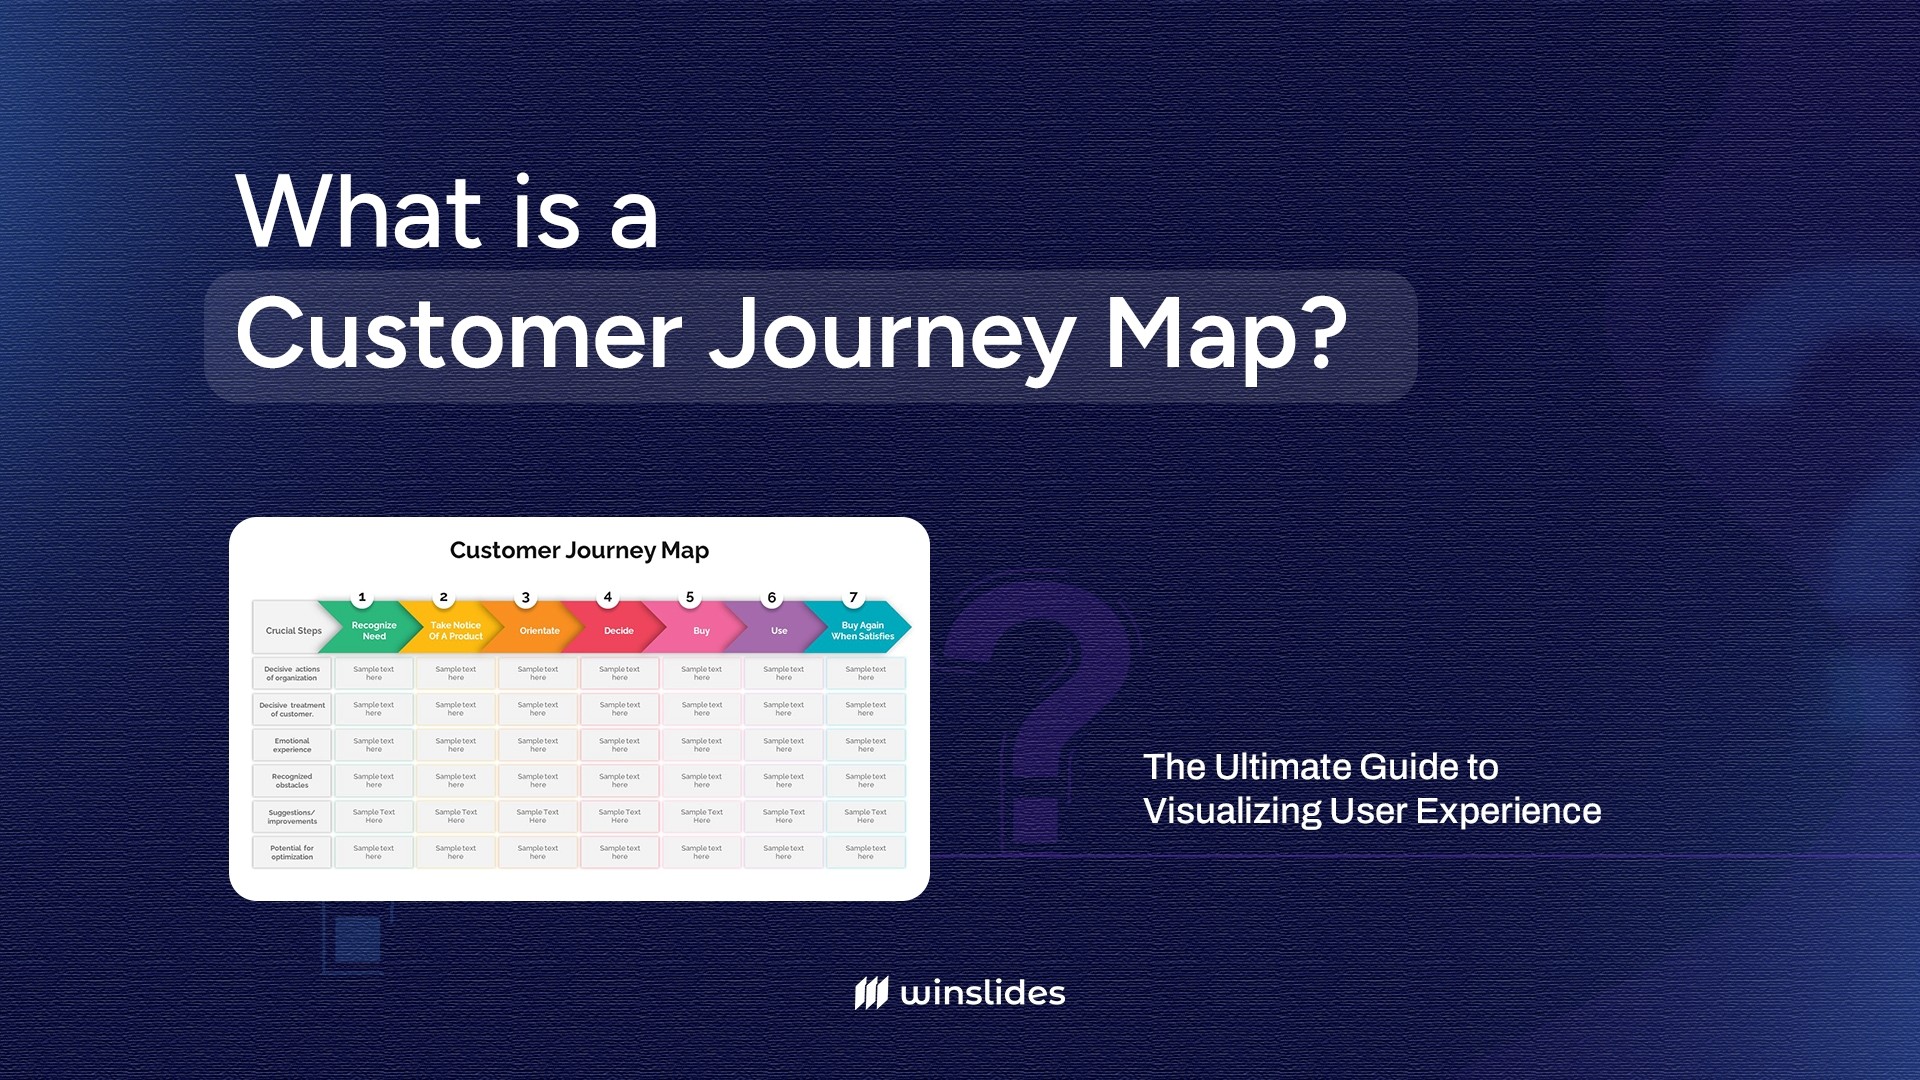
What is a Customer Journey Map? The Ultimate Guide to Visualizing User Experience
Defining the Customer Journey Map: The “Visual Story” of Your User
In today’s experience-driven economy, 80% of customers consider the experience a company provides to be just as important as its products. If your checkout process is clunky, or your support email goes into a black hole, you lose business. But spotting these friction points is impossible if you are just looking at rows of data in a spreadsheet.
So, what is a Customer Journey Map? A Customer Journey Map is a visual representation of every interaction a customer has with your brand—from the moment they first hear your name to the moment they buy (and hopefully, return). It tells the story of their experience, highlighting their emotions, struggles, and moments of delight.
It isn’t just a diagram; it’s a strategic tool. In this guide, we’ll break down exactly what goes into a map, the different types you can create, and how to build one that transforms your business strategy using WinSlides templates.
What is Customer Journey Map? What is Meant by Customer Journey Mapping?

While the terms are often used interchangeably, there is a distinct difference between the tool and the process.
A Customer Journey Map is the visual artifact—a diagram or infographic that illustrates the steps your customer goes through in engaging with your company. It tells the story of their experience from their perspective, capturing their thoughts, feelings, and actions at every touchpoint, from initial awareness to post-purchase support.
Customer Journey Mapping, on the other hand, is the strategic exercise of creating that visualization. It is the investigative process where your team steps out of the office and into the customer’s shoes. “Mapping” isn’t just about drawing lines on a whiteboard; it is an exercise in empathy that forces you to research, analyze behavior, and identify the gaps between what you think you are delivering and what the customer is actually experiencing.
In short: The Map is the document you present; Mapping is the journey your team takes to understand the customer.
The 5 Essential Elements to Build a Customer Journey Map
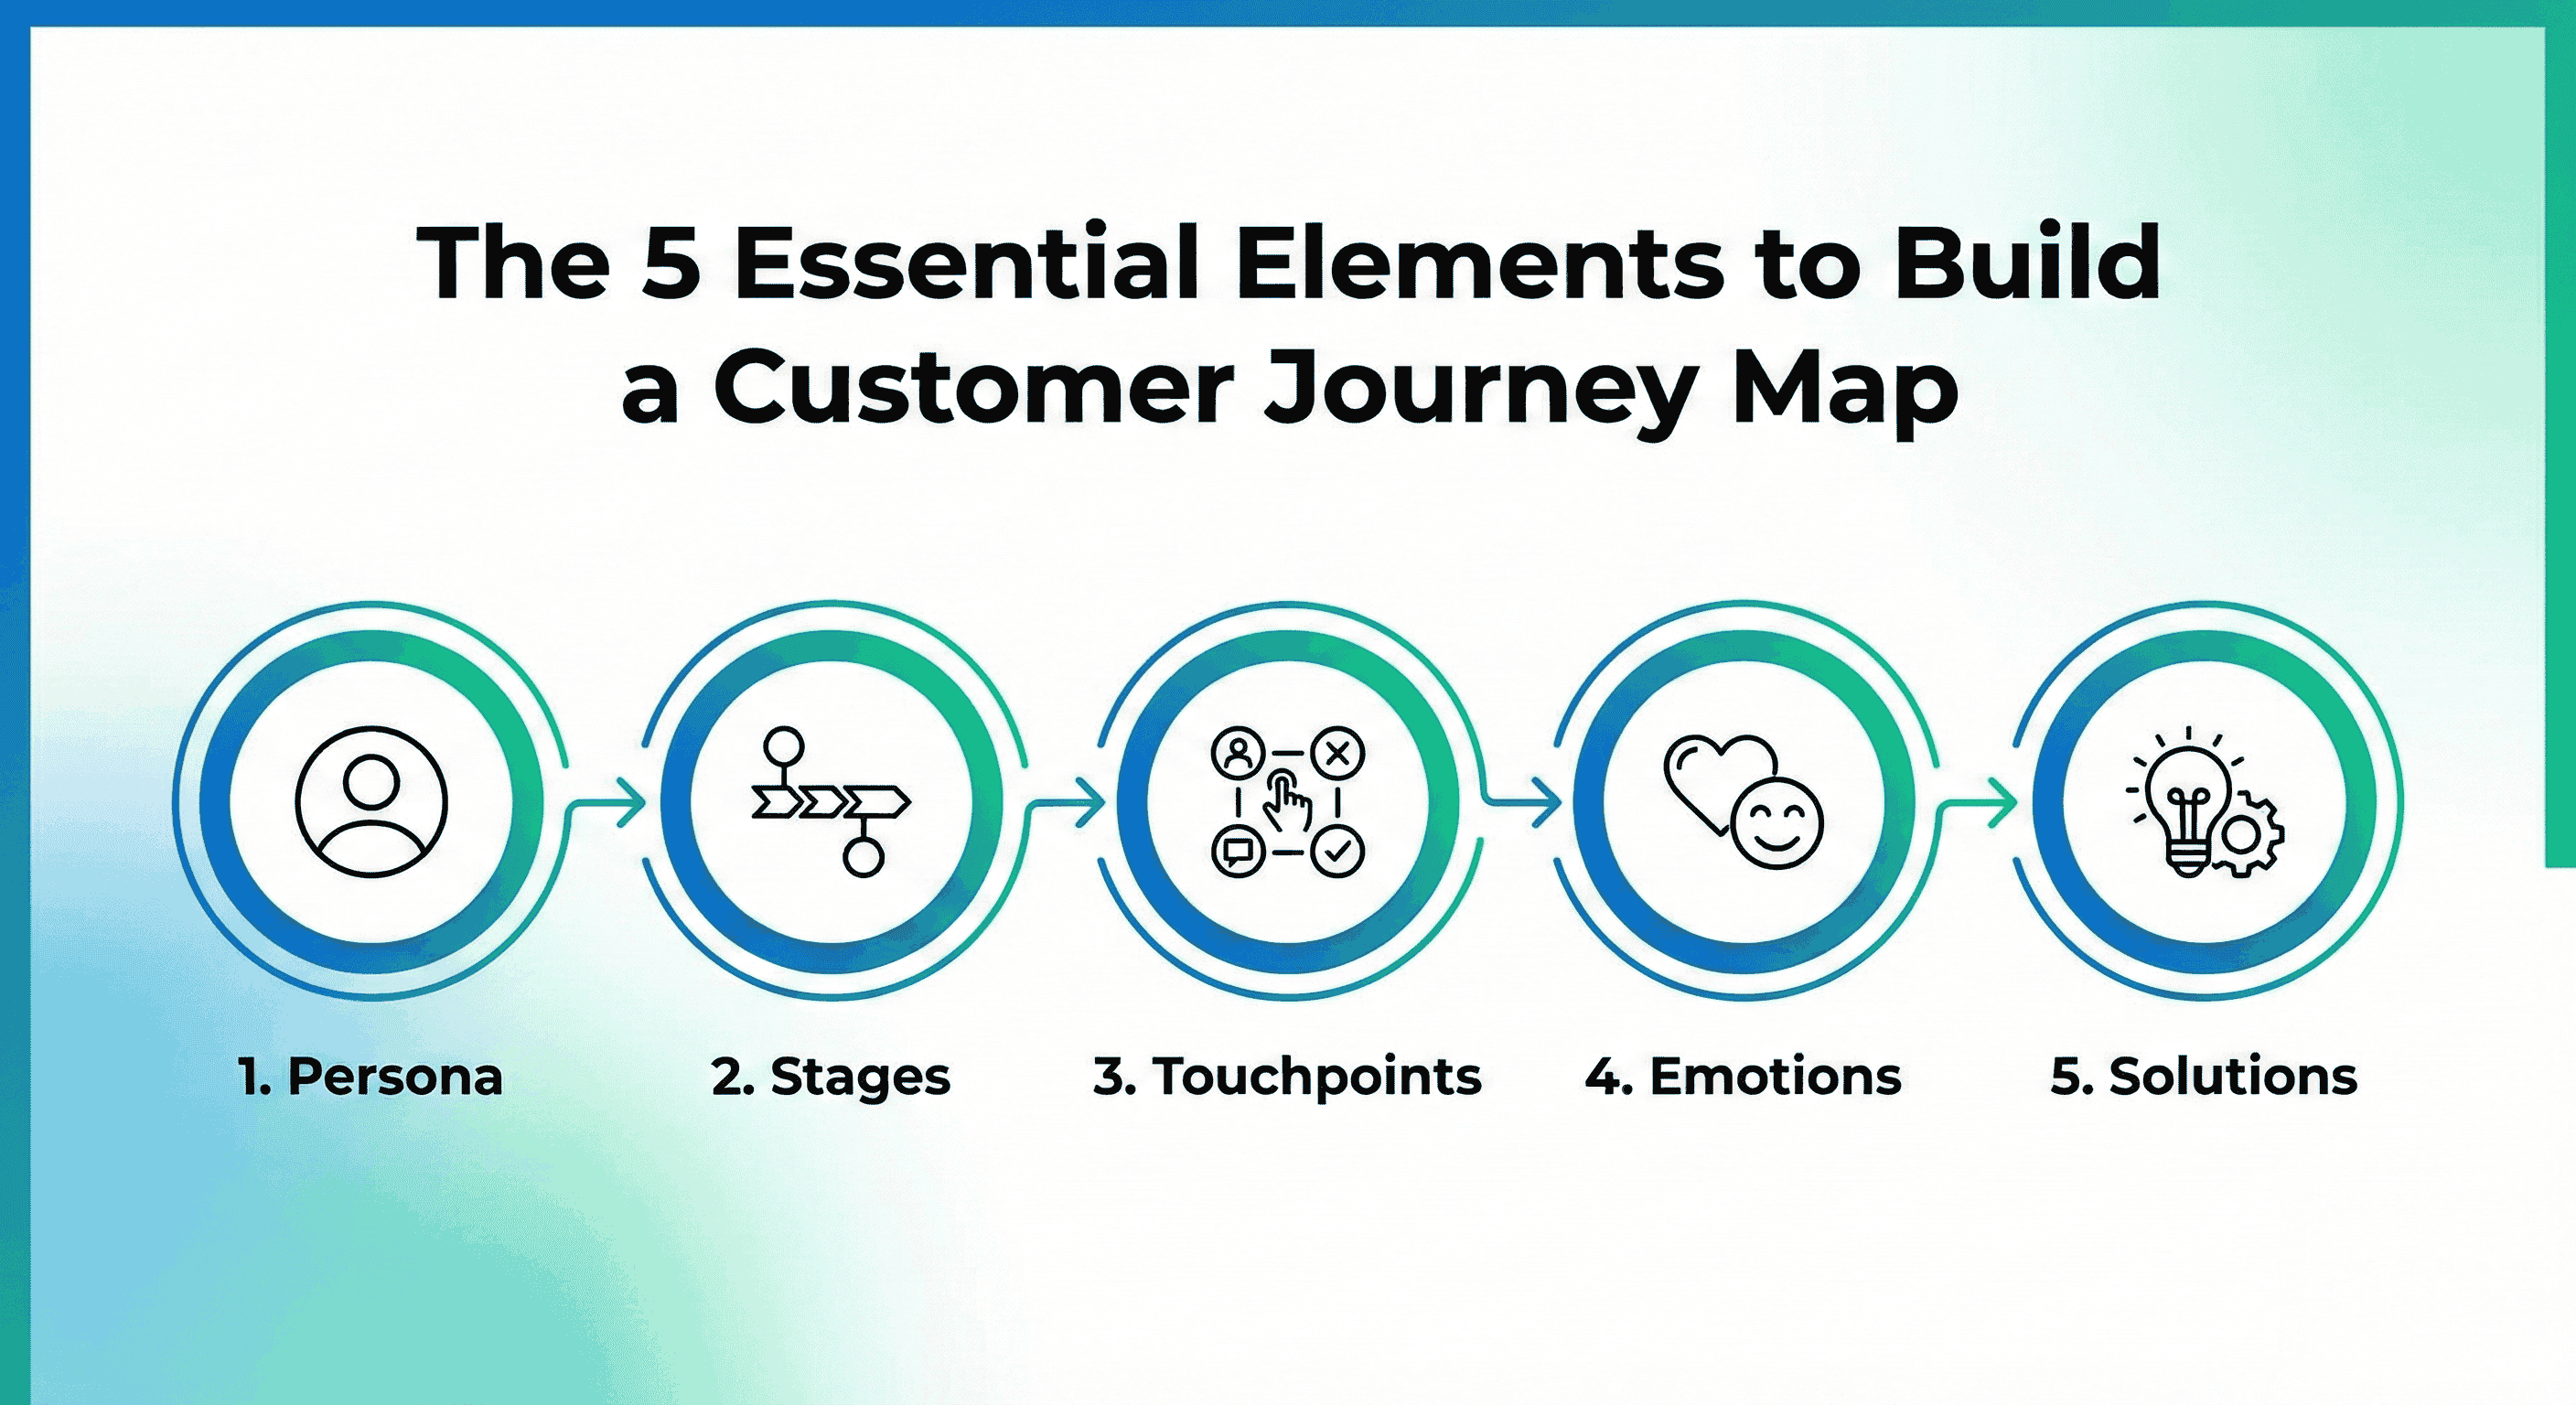
A Customer Journey Map can be a simple sketch or a complex infographic, but to be effective, it must include five core components. Think of these as the “swimlanes” that organize your data.
1. The Persona (The “Who”)
You cannot map a journey for “everyone.” A CEO making a software purchase behaves very differently from a college student buying sneakers. To be accurate, your map must focus on one specific Buyer Persona.
- What to include: Give them a name (e.g., “Manager Mike”). Define their goals, motivations, and tech-savviness.
- Why it matters: If you try to map every customer type on one slide, you will end up with a generic mess that offers no real insight.
2. The Phases (The Timeline)
This is the horizontal axis of your map—the chronological backbone of the journey. While every business is different, most follow a variation of the standard lifecycle:
- Awareness: Realizing they have a problem.
- Consideration: Researching solutions and comparing you vs. competitors.
- Decision: The moment of purchase.
- Service: The onboarding, delivery, or support experience.
- Loyalty: Becoming a repeat buyer or advocate.
3. Touchpoints (The “Where”)
These are the specific moments where the customer interacts with your brand. You need to list everything.
- Digital: Facebook ads, website landing pages, email newsletters, chatbots.
- Physical: Store layout, unboxing experience, speaking to a sales rep, invoice receipt.
- Invisible: Don’t forget the touchpoints you don’t control, like reading a Google Review or hearing a recommendation from a friend.
4. Customer Emotions (The “How”)
This is the “heartbeat” of your map and what distinguishes a Journey Map from a boring process diagram. At each stage, you must plot the customer’s sentiment.
- High Point (Delight): “Wow, the shipping was free and fast!”
- Low Point (Frustration): “Why do I have to create an account just to browse?”
- WinSlides Pro Tip: Use a line graph or emojis in your presentation to visually track these emotional dips. The lowest point on the graph is usually where you are losing the most customers.
5. Pain Points & Opportunities
Data is useless without action. This final layer turns your map into a strategic weapon.
- The Pain Point: Identify the friction. (e.g., “The pricing page is confusing.”)
- The Opportunity: Propose the solution. (e.g., “Add a feature comparison table.”) By aligning every “Pain” with a specific “Opportunity,” you give your team a clear roadmap for what needs to be fixed first.
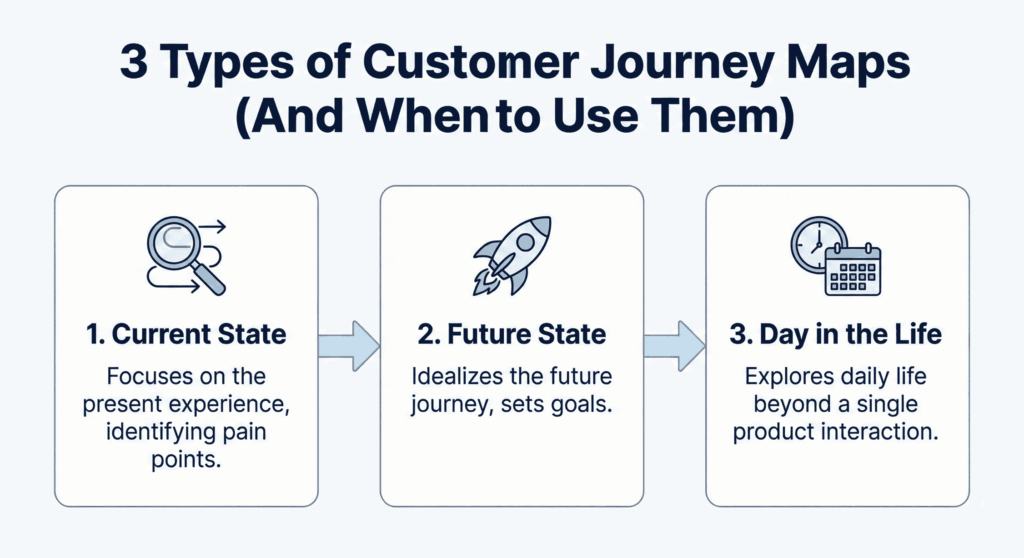
3 Types of Customer Journey Maps (And When to Use Them)
Not all maps serve the same purpose. Depending on your business goal—whether you are fixing a broken process or inventing a new product—you will need a different visualization. Here are the three most common types and when to use them.
1. Current State Map (The Reality Check)
This is the most common and widely used type of map. It visualizes exactly what your customers are experiencing right now—the good, the bad, and the ugly. It does not look at what you want to happen; it looks at what is happening based on actual data and observation.
- When to use it: When you need to identify why customers are churning, fix immediate bugs in your service, or streamline a confusing onboarding process. It is your diagnostic tool.
2. Future State Map (The Vision)
While the Current State map looks back, the Future State map looks forward. It visualizes the ideal journey you want to create for your customers. It frees you from current technical limitations and allows for “blue sky” thinking.
- When to use it: When you are planning a new product launch, pitching a major strategic pivot to stakeholders, or reimagining your customer experience (CX) from scratch. It acts as a “North Star” for your design and engineering teams.
3. Day in the Life Map (The Context)
This map zooms out. Instead of focusing just on the moments when a customer interacts with your brand, it maps their entire day—their commute, their meetings, their family time. It places your product within the wider context of their life.
- When to use it: When you need to understand user behavior outside of your app. For example, knowing that your user is rushing to catch a train while using your app might reveal why speed is more important to them than advanced features. Use this to discover entirely new market opportunities or unmet needs.
How to Create a Customer Journey Map? Customer Journey Mapping Process
Building a map might feel like a massive undertaking, but it doesn’t have to be. By following a structured workflow, you can turn scattered data into a clear visual story. Here is the step-by-step process:
Step 1: Research (Don’t Guess)
The biggest mistake companies make is locking a few executives in a conference room to “brainstorm” the journey. This leads to a map based on assumptions, not reality. You need cold, hard data.
- Quantitative Data: Look at your Google Analytics. Where are users dropping off? Look at your Heatmaps. What are they clicking on (or ignoring)?
- Qualitative Data: This is crucial. Talk to your customer support team—they know exactly what customers complain about. better yet, conduct user interviews and ask them directly: “What was the hardest part of signing up?”
Step 2: Define the Scope & Persona
Before you draw a single line, define the boundaries.
- Choose the Persona: Pick one specific customer type (e.g., “Small Business Owner”). Do not try to map every customer segment on a single map, or it will become unreadable.
- Choose the Goal: Are you mapping the entire lifecycle (Awareness to Loyalty) or just a specific slice (e.g., The Onboarding Process)? Be specific.
Step 3: Map the Actions & Emotions
This is the core “mapping” phase.
- Plot the Actions: List every step the customer takes. Example: Clicks ad -> Lands on site -> Reads pricing -> Chats with bot.
- Layer the Emotion: Underneath each action, note how the customer feels. Is this a moment of confusion? Anticipation? Frustration?
- Find the “Dip”: Look for the lowest point on the emotional curve. If users feel “Anxious” during checkout, that is your critical failure point.
Step 4: Visualize for Impact
Once you have your data, do not present a messy spreadsheet or a photo of sticky notes to your stakeholders. To get budget for improvements, you need to sell the story. You need to translate your findings into a polished, professional visual. This is where a design template becomes essential—turning complex behavioral data into a clear, compelling narrative that executives can understand at a glance.
Why Use a Customer Journey Maps?
Many businesses think they know what their customers experience, but they are often looking at it from the inside out—focusing on sales targets rather than user struggles. A Customer Journey Map flips the script. It forces you to step out of the boardroom and walk in your customer’s shoes, revealing the actual reality of interacting with your brand—including the friction points you didn’t even know existed.
Benefits of Customer Journey Mapping
- It Builds Empathy: It shifts your team’s focus from cold spreadsheets (“we need more leads”) to human emotions (“our users feel anxious during sign-up”), helping you build a product people actually love.
- It Breaks Down Silos: Marketing, Sales, and Support often work in isolation. A map shows the entire ecosystem, revealing where handoffs between departments are failing and causing customers to slip through the cracks.
- It Exposes Blind Spots: You might think your service is perfect, but a map can reveal the “invisible” gaps—like a confusing confirmation email or a slow loading page—that are silently killing your conversion rates.
- It Improves Retention: By identifying the exact moment where customers feel frustrated or neglected, you can fix the “leaky bucket” and turn at-risk users into loyal advocates.
Best Customer Journey Map Example for Your Next Presentation ( Customer Journey Mapping Tools)
You are a strategist, not a graphic designer. Wrestling with arrows and icons in PowerPoint is a waste of your valuable time. To get immediate buy-in from your stakeholders, you need visuals that look professional and tell a clear story.
Here are three top-rated templates that will make your customer journey mapping presentation stand out.
1. Customer Journey Stages Map
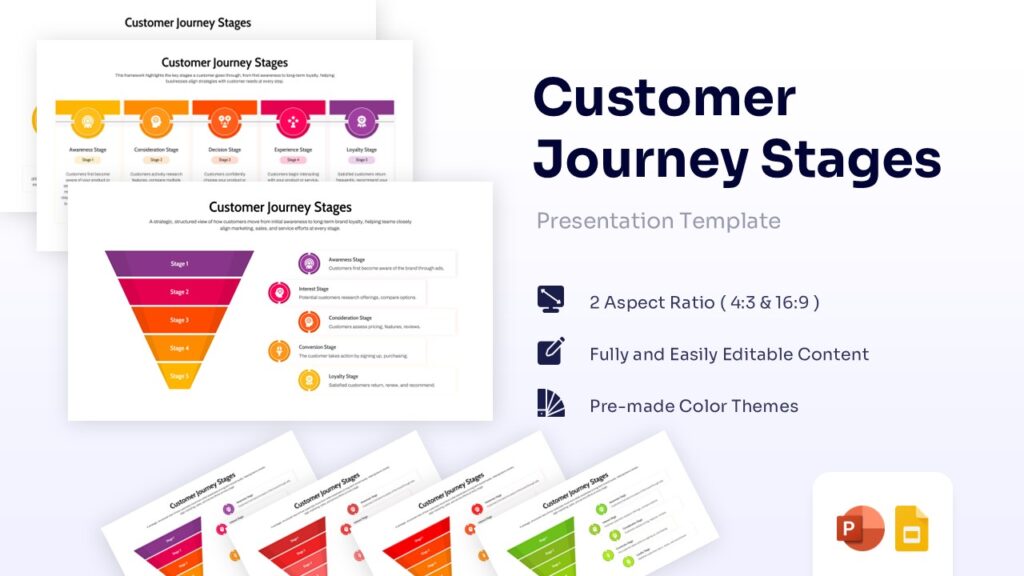
View: Customer Journey Map
Best for: Comprehensive, end-to-end visualization.
Why use it: This is the “heavy lifter” of journey maps. If you need to show the complete picture—aligning the marketing funnel (Awareness to Action) with specific timelines and internal process steps—this is your go-to deck. It is perfectly structured to help operations and sales teams understand exactly where they fit into the bigger picture, ensuring no stage of the lifecycle is overlooked.
2. Colorful Customer Journey Mapping Template

View: Career Journey Map Template
Best for: High-impact presentations and creative pitches.
Why use it: Data doesn’t have to be dull. When you are presenting to a room full of tired executives, you need to grab their attention. This template uses vibrant color-coding to clearly distinguish between different emotional phases and touchpoints. The high contrast ensures that your key insights—specifically the customer “pain points”—pop off the screen and command attention.
3. Versatile Customer Journey Mapping Template by SlideBazaar
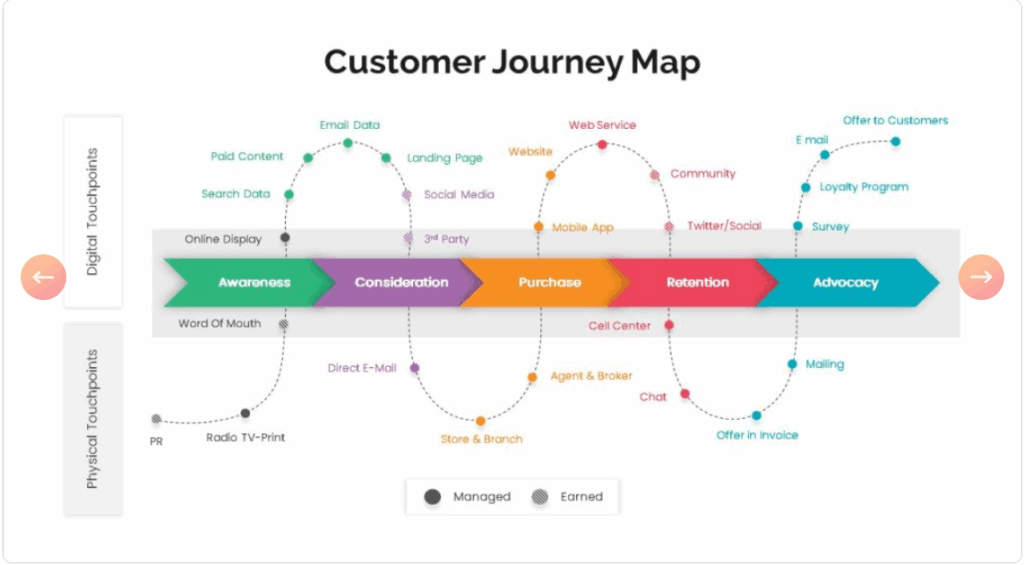
View: Versatile Customer Journey Map
Best for: Omnichannel brands tracking the “weave” between online and offline worlds.
Why use it: Modern customers don’t stay in one lane; they jump between devices and real-world interactions. This template is designed to visualize that complex reality.
- Digital vs. Physical Split: Unlike linear lists, this layout visually separates Digital Touchpoints (top) from Physical Touchpoints (bottom). This helps you instantly spot gaps in how your mobile app connects to your in-store experience.
- The “Sine Wave” Path: The curved dotted line perfectly illustrates how users bounce between channels—checking social media, visiting a store, and then reading an email—rather than walking a straight line through the funnel.
- Control Factor: It adds strategic depth with a specific legend for “Managed” vs. “Earned” media, helping you distinguish between the touchpoints you control (like ads) and the ones you don’t (like word-of-mouth).
5 Proven Ways to Improve Customer Experience
Creating a map identifies the “holes” in your bucket. Now, you need to patch them. Improving the buyer journey isn’t just about adding new features; it is about removing obstacles and making the path to purchase as smooth as possible. Here is how to do it:
1. Personalize the Experience
Customers expect you to know them. If a user has already bought your software, do not show them ads to “Try it Free.” Use your data to segment your audience.
- The Fix: Delivering relevant content based on where they are in the journey (e.g., sending a “Power User Tips” guide to a customer who just completed onboarding).
2. Remove Friction at Critical Touchpoints
Every extra click is a chance for a customer to leave. Friction kills conversion.
- The Fix: Audit your “Decision” phase. Can a user buy as a guest, or do they have to create an account? Is the pricing transparent? Reduce the number of steps required to complete a task. Think “Amazon 1-Click” efficiency.
3. Unify Your Communication (Omnichannel)
There is nothing more frustrating for a buyer than repeating their story to three different people.
- The Fix: Ensure your Sales, Support, and Marketing tools talk to each other. If a customer complains on Twitter, your email support team should know about it before they reply. The experience should feel like one continuous conversation, regardless of the channel.
4. Be Proactive, Not Reactive
Don’t wait for the customer to ask for help. Anticipate their needs.
- The Fix: If you know shipping is delayed, tell them before they track the package. If a subscription is about to renew, send a reminder. Proactive communication builds trust and reduces “Customer Anxiety.”
5. Close the Feedback Loop
Many companies ask for feedback (NPS surveys) but few act on it.
- The Fix: When a customer reports a pain point, fix it, and then tell them you fixed it. This “closing of the loop” turns a disgruntled user into a loyal advocate because they feel heard.
Customer Journey Map vs. Sales Funnel: What’s the Difference?
Before you start mapping, it is crucial to clear up a common misconception: A Customer Journey Map is not a Sales Funnel. While they both track the path to purchase, they look at the world from opposite directions.
- The Sales Funnel is Internal (Your Goal): It is linear, predictable, and focused entirely on what you want the customer to do. It assumes a straight line: Lead → Qualified Prospect → Sale. It ignores the messy reality of human behavior and focuses strictly on your conversion metrics.
- The Customer Journey Map is External (Their Goal): It is focused on what the customer actually does. It captures the chaos—the research loops, the pauses, the frustrations, the competitor comparisons, and the post-purchase feelings. It tells the story of the experience, not just the transaction.
Key Takeaway: The sales funnel measures your success (revenue); the journey map measures the customer’s success (satisfaction). You need both, but you cannot swap one for the other.
Conclusion: Turn Insights into Action
A Customer Journey Map is more than just a colorful diagram; it is an empathy engine. By visualizing the friction in your process, you stop arguing about internal opinions and start solving real user problems.
But remember, a map is useless if it stays in a drawer. You need to present it, champion it, and use it to drive change across your organization. Don’t let bad design get in the way of a good strategy.
Ready to start mapping? Skip the design struggle and bring your customer’s story to life today with WinSlides’ professionally designed Customer Journey Collection.
Related Blogs
-
How to Write an Elevator Pitch: The Ultimate Step-by-Step Guide
Creative elevator pitch examples for every scenario The average human attention span is now reportedly less than that of a goldfish—about 8 seconds. In a world of endless distractions, like Instagram reels, YouTube shorts, you don’t have time for long introductions. You need to hook your audience immediately, whether you are in a networking meeting,…
-

What is a Sales Presentation? The Ultimate Guide to Create Perfect Sales Presentation That Close Deals
How to Create a Sales Presentation – Improve your Sales Presentation Did you know that 41% of decision-makers admit to multitasking or losing focus during a sales pitch? In today’s competitive market, you have less than seven seconds to grab a prospect’s attention before they mentally check out. If your slides are cluttered or your…