colorful circular diagram template
This template is part of a deck featuring multiple slides. To check out all slides.
See All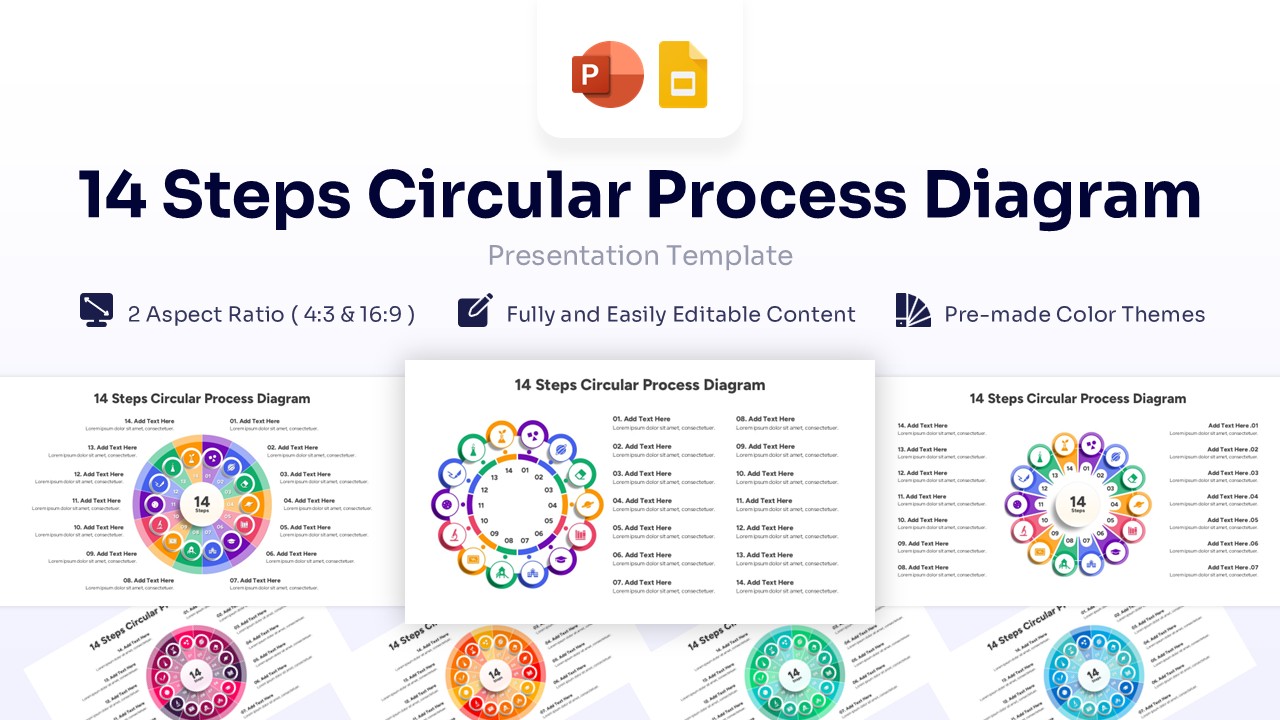
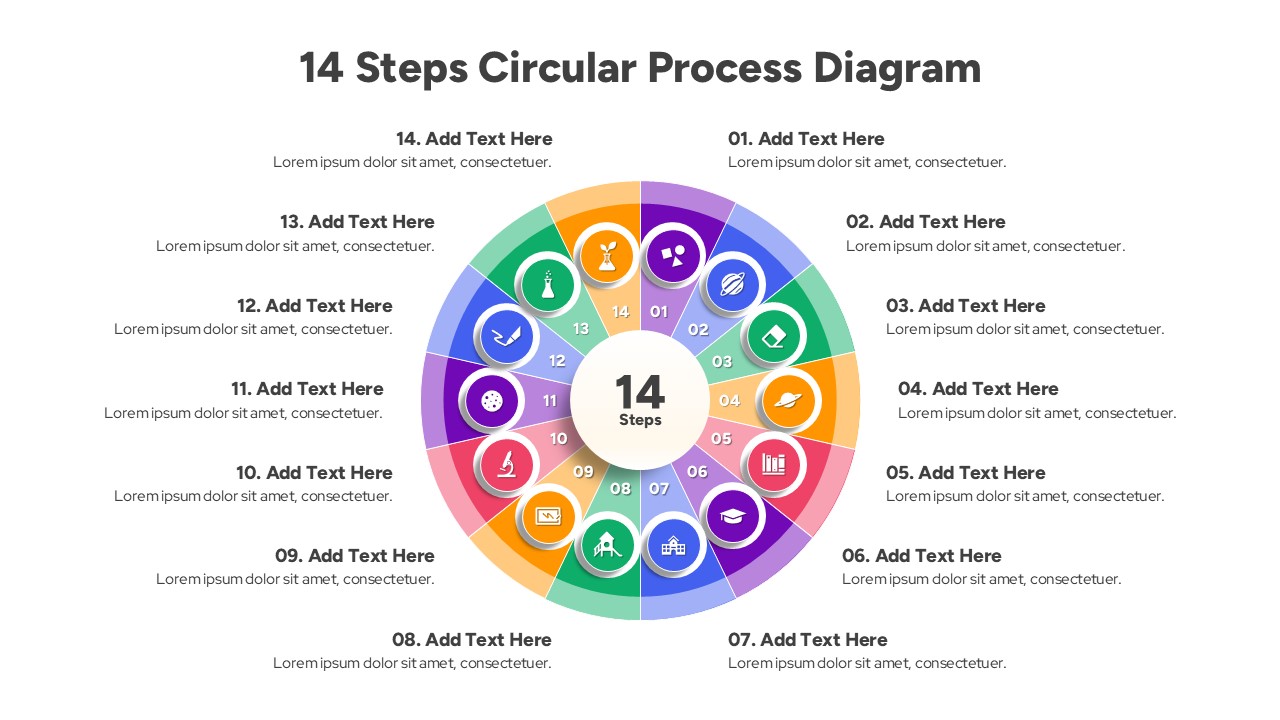
14 Phase Cycle Infographic Presentation Template
Download this 14 Steps Circular Process Diagram to clearly visualize complex workflows and recurring cycles in your next presentation. This comprehensive template features a central hub surrounded by fourteen distinct, color-coded circular nodes, making it perfect for breaking down long procedures into manageable, easy-to-follow stages. Whether you are outlining a business roadmap, a detailed project timeline, or an academic lesson plan, this infographic template helps your audience grasp the full scope of the process at a single glance without feeling overwhelmed.
Designed for flexibility, this slide allows you to fully customize every element to match your branding or topic. You can easily modify the text placeholders to add descriptions for each step, swap out the icons to represent specific tasks, and adjust the color scheme to align with your corporate identity. The visual hierarchy naturally guides the viewer’s eye around the circle, ensuring a logical flow of information. It supports both 4:3 and 16:9 aspect ratios, ensuring your slides look sharp on any screen size.
This versatile framework is excellent for a wide variety of professional and educational use cases. Use it to illustrate product life cycles, continuous improvement strategies, monthly agendas, or step-by-step operating procedures. It is also effective for showing the relationship between a central core idea and its various contributing factors or outcomes. By presenting data in this structured circular format, you turn a simple list into an engaging visual story that improves retention and understanding.
Why use this Circular Process Diagram
- Simplifies complex data into an organized, easy-to-read visual format.
- Saves significant design time compared to building a 14-step diagram from scratch.
- Enhances audience engagement by replacing text-heavy slides with dynamic graphics.
- Ensures a professional, polished look that builds confidence in your presentation.
Who is it for
Project managers, business analysts, and operations leads mapping out workflows. It is also ideal for educators explaining cycles, marketing teams outlining campaign steps, and human resources professionals presenting onboarding processes or annual reviews.