Editable Map of Africa Template for PowerPoint & Google Slides


Africa Continent Map Presentation Template
Download this Editable Africa Map and show regional data, market presence, or geographic insights with professional clarity. Whether you are outlining a pan-African business expansion, highlighting specific country-level demographics, or presenting educational content about the continent’s diverse regions, this template provides a clean and supportive framework. Using a map helps your audience instantly grasp spatial relationships and regional impacts, making your data feel more grounded and easier to follow.
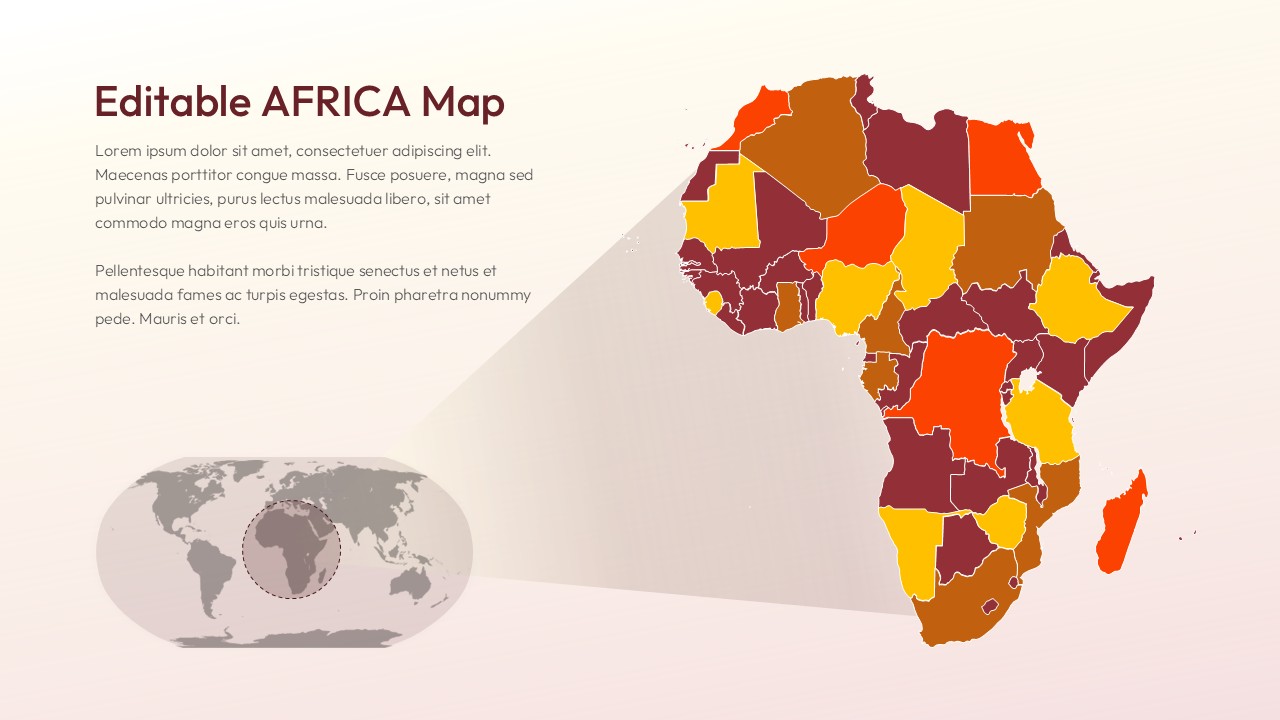
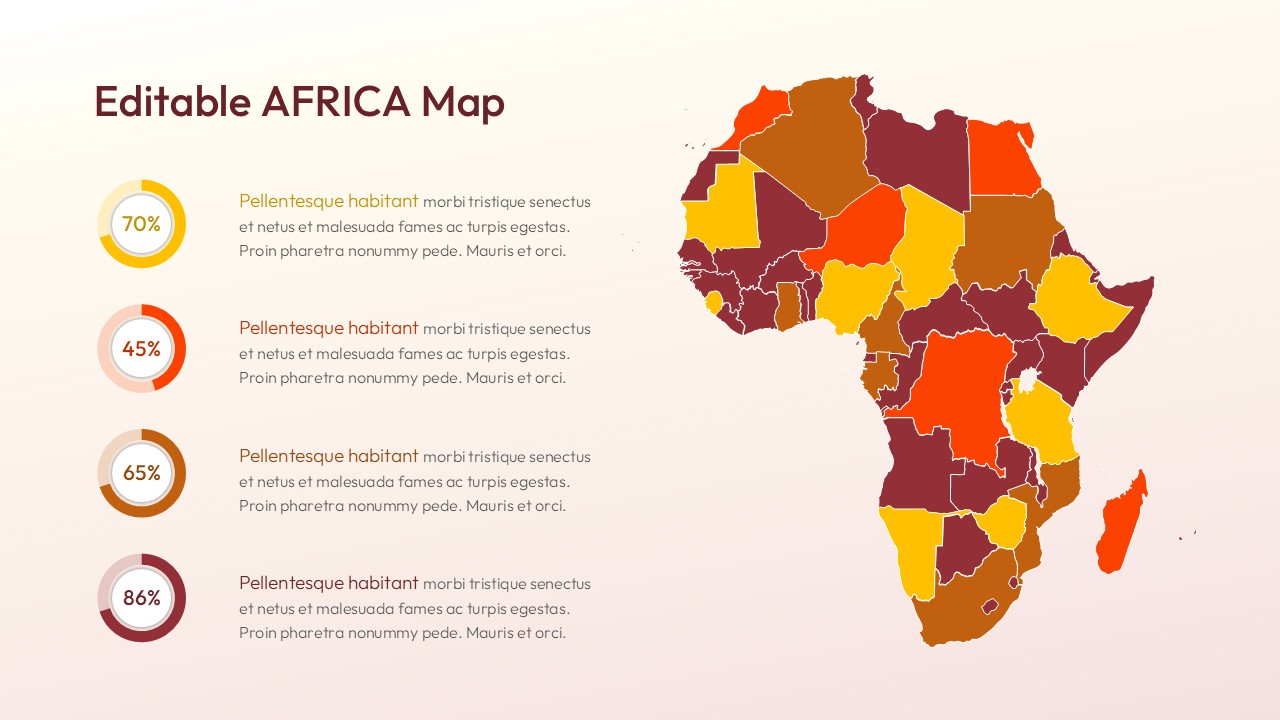
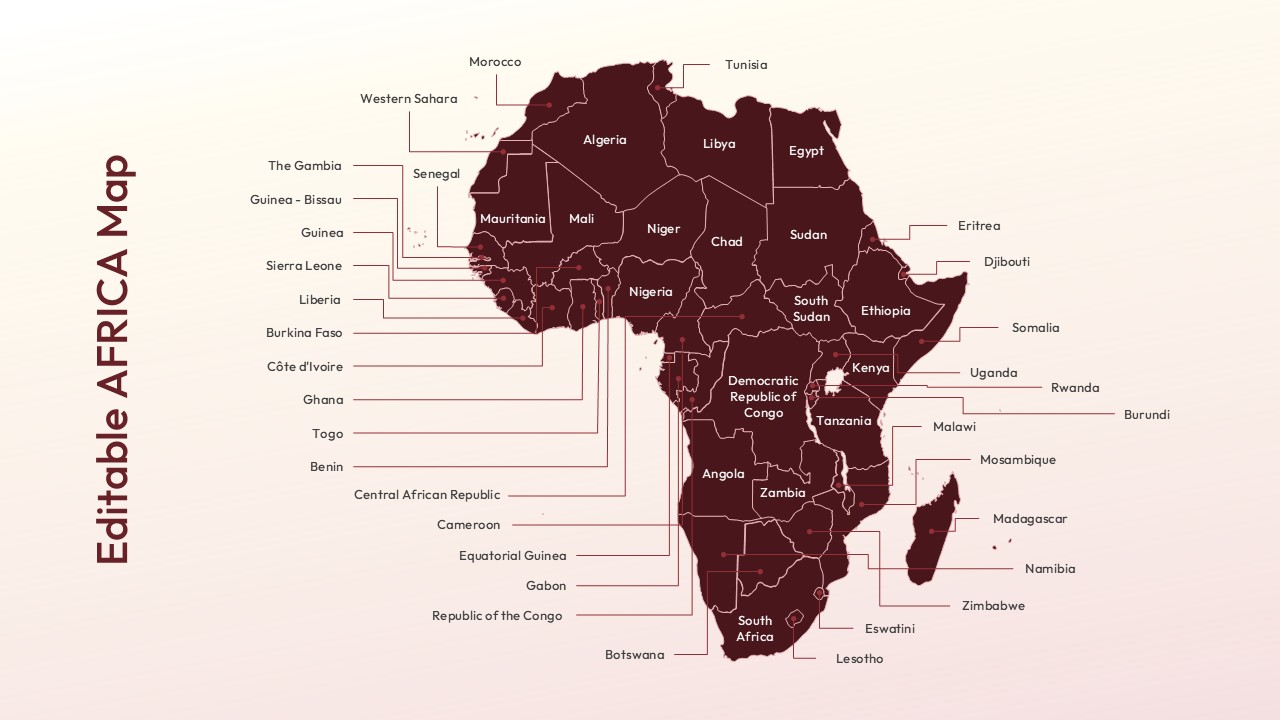
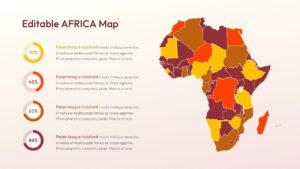
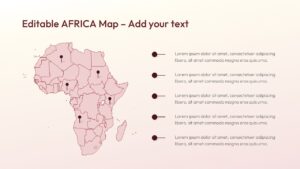
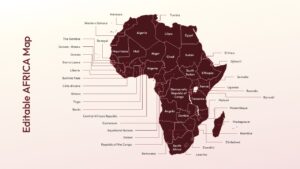
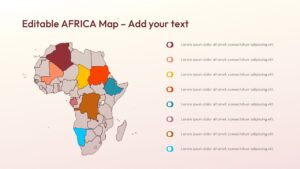
This presentation tool features high-quality vector outlines of the African continent, including individual country borders that you can click and customize. The set includes a variety of layouts, from labeled political maps to data-driven slides with percentage gauges and pin markers. By using secondary keywords like regional infographics and continental data visualization, you can ensure your deck looks polished while delivering complex geographical information in a simple, digestible format.
These templates are versatile enough for almost any professional context. Use them to track supply chain routes across West Africa, visualize sales performance in South Africa, or map out NGO initiatives in East Africa. The clean, modern aesthetic ensures your slides remain the focal point without distracting from your core message, helping you feel prepared and in control during your meeting.
Why Use this Africa Map Template
- Provides a clear visual overview of the African continent to help audiences stay oriented.
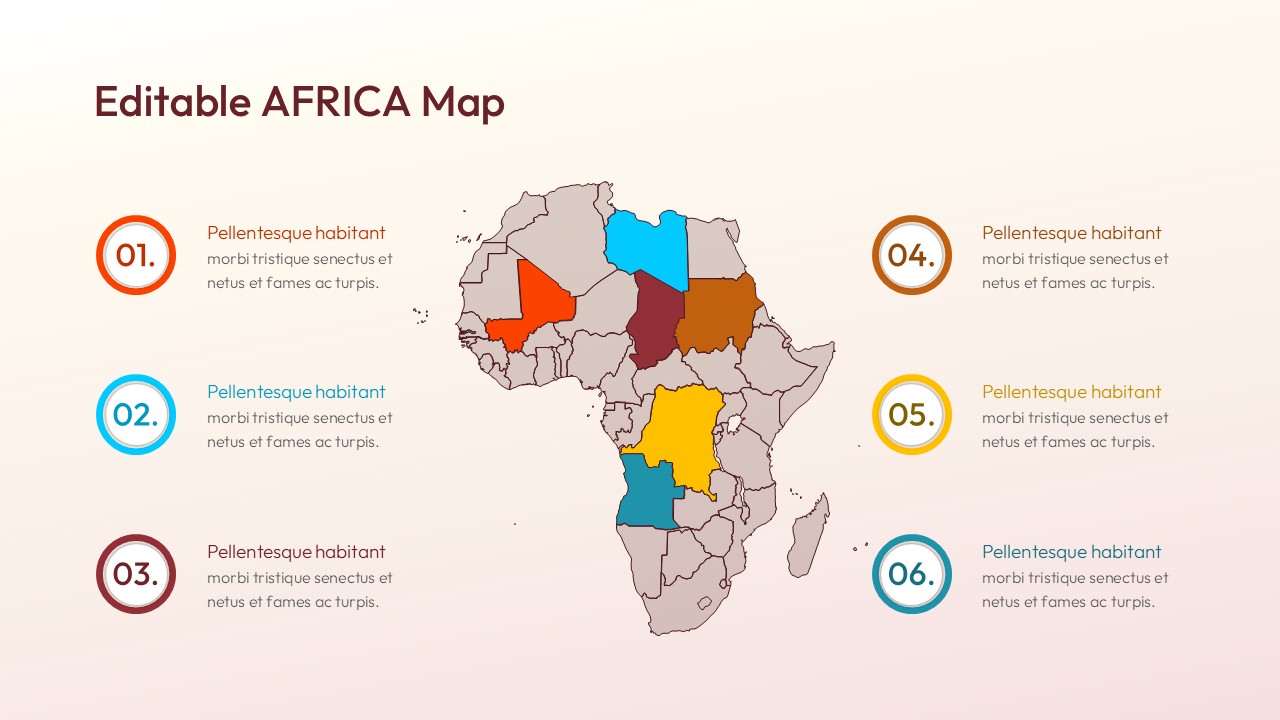
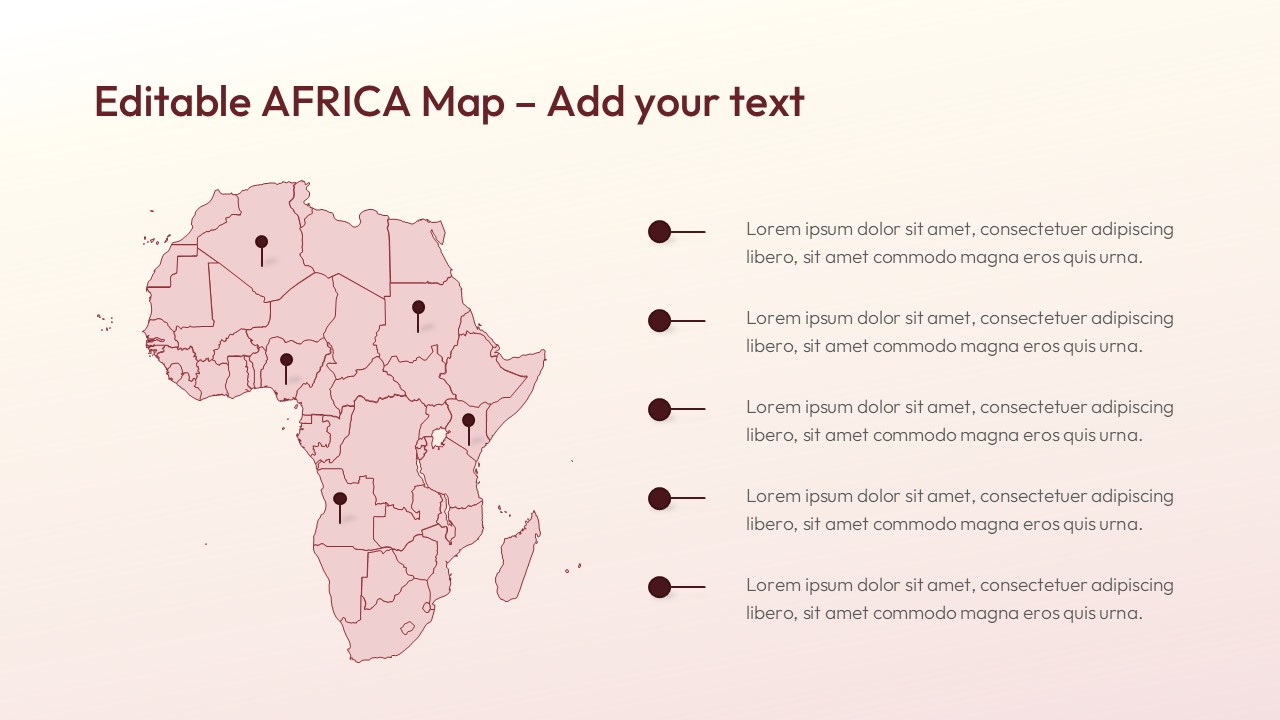
- Saves hours of design time with pre-made layouts for location tagging and data sharing.
- Allows for complete customization of country colors to match your specific brand or data set.
- Maintains high resolution and professional quality across all screen sizes and platforms.
Who Should Download this Africa Continent Map
Business analysts, regional managers, and marketing professionals focusing on African markets. It is also a great resource for educators, researchers, and non-profit coordinators who need to present geographic data or social metrics. Other users include travel agencies, logistics planners, and strategy consultants preparing executive briefings.
Why Use this Editable Map – Regional Data Visualization, Geographic Infographics
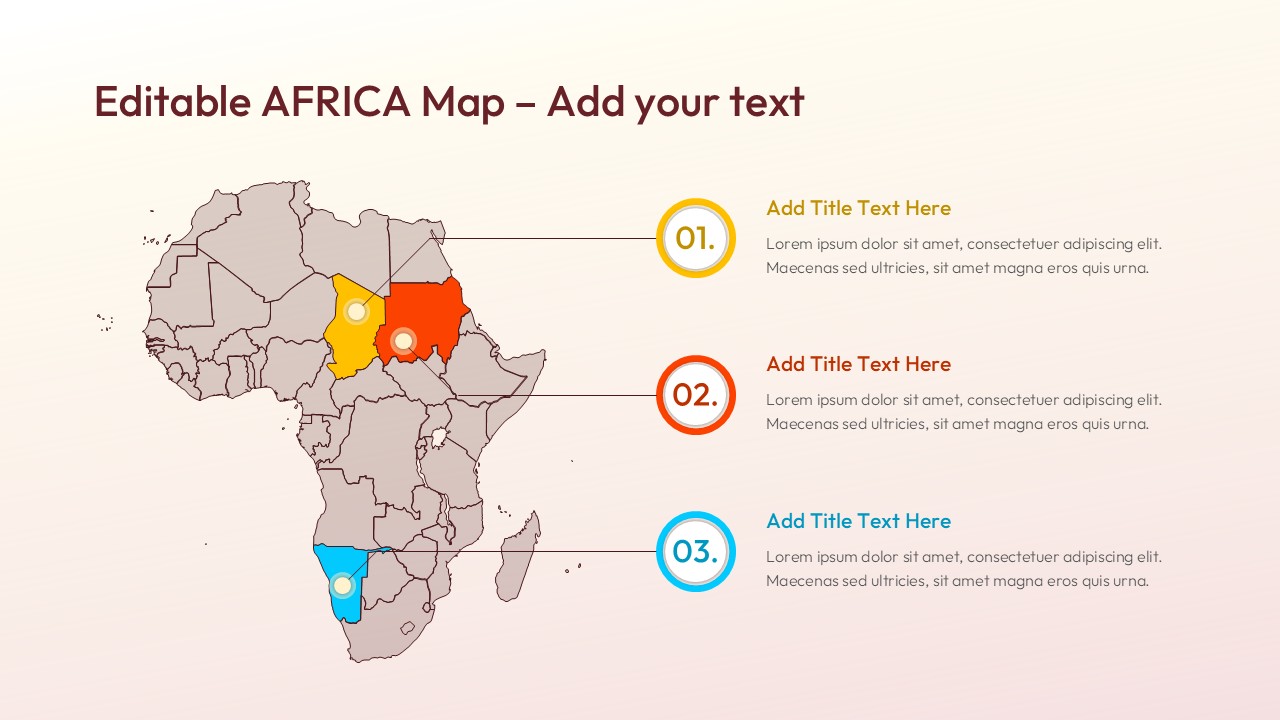
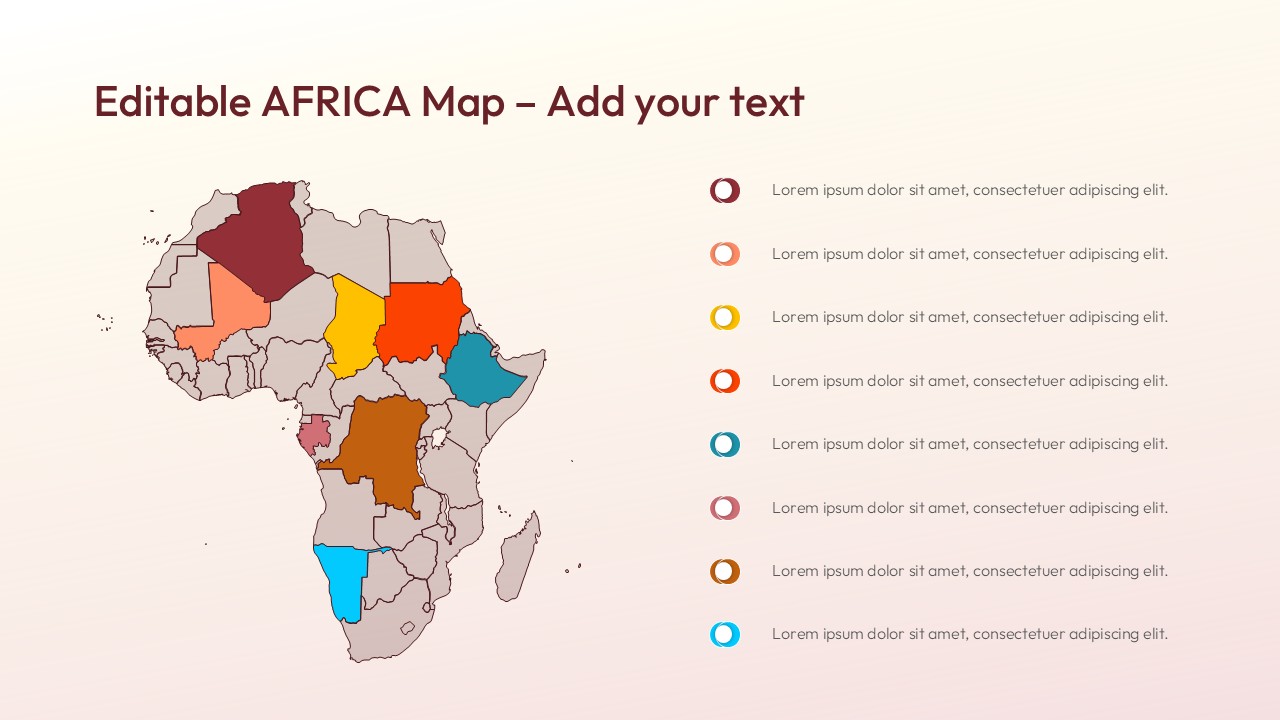
- Highlights specific African countries with easy-to-edit color zones.
- Includes pin markers and location tags for precise site reporting.
- Features circular data gauges for showing regional market share.
- Simplifies complex continental data into a single, polished slide.
Who is it for – Regional Managers, Market Analysts, Educators
- Strategy teams planning expansion into African territories.
- Logistics experts mapping out transportation and trade routes.
- University professors teaching African geography or politics.
- NGOs presenting impact reports across different regions.
Key Features
- 100% Vector-Based Graphics
- Fully Layered & Organized
- Multi-Platform Support
- Theme Color & Theme Font
Frequently Asked Questions
- Can I change the color of individual countries?
- Yes, every country is a separate vector shape, allowing you to change colors or move individual elements to highlight specific areas of interest.
- Is this template compatible with both Mac and PC?
- Absolutely. It works seamlessly on PowerPoint for both Mac and Windows, as well as on Google Slides through any web browser.
- Do I need advanced design skills to use this map?
- Not at all. We’ve designed this to be \"plug-and-play.\" If you can click and drag, you can customize this map to look like a pro deck.
Related Templates
-
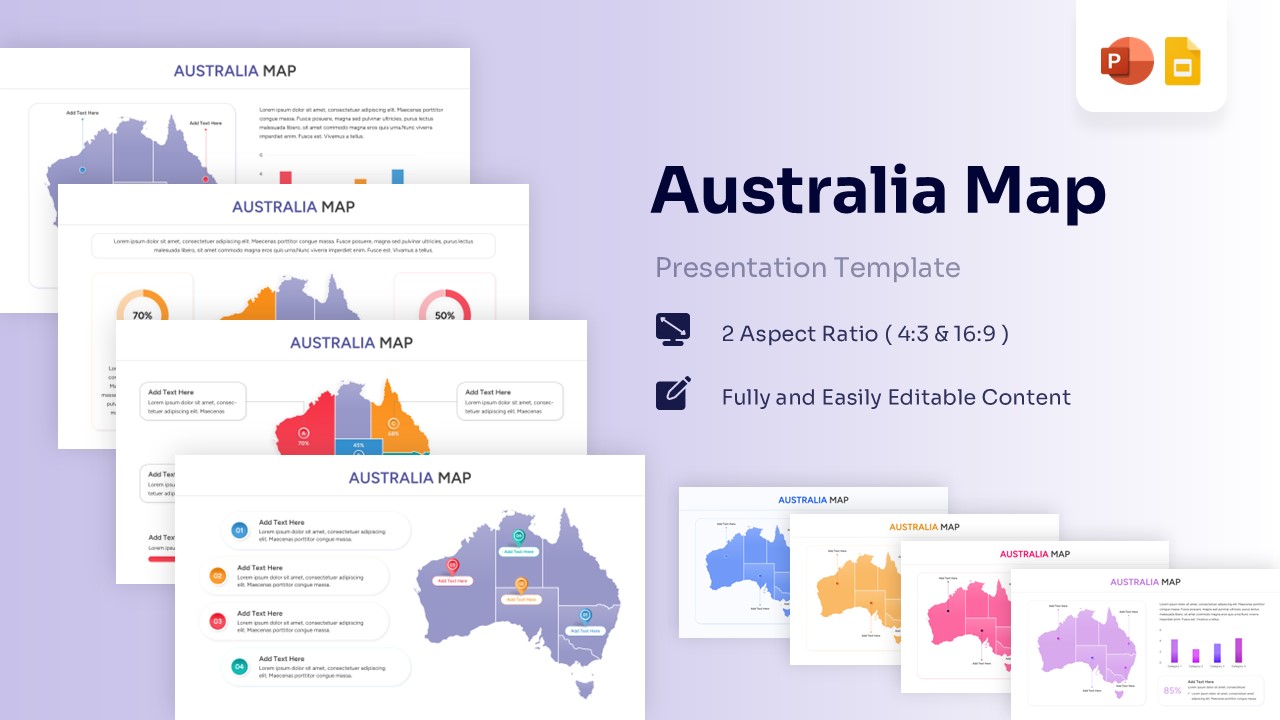
Australia Map for PowerPoint & Google Slides
Country Maps
$3.99 -
-
-
 $2.99
$2.99