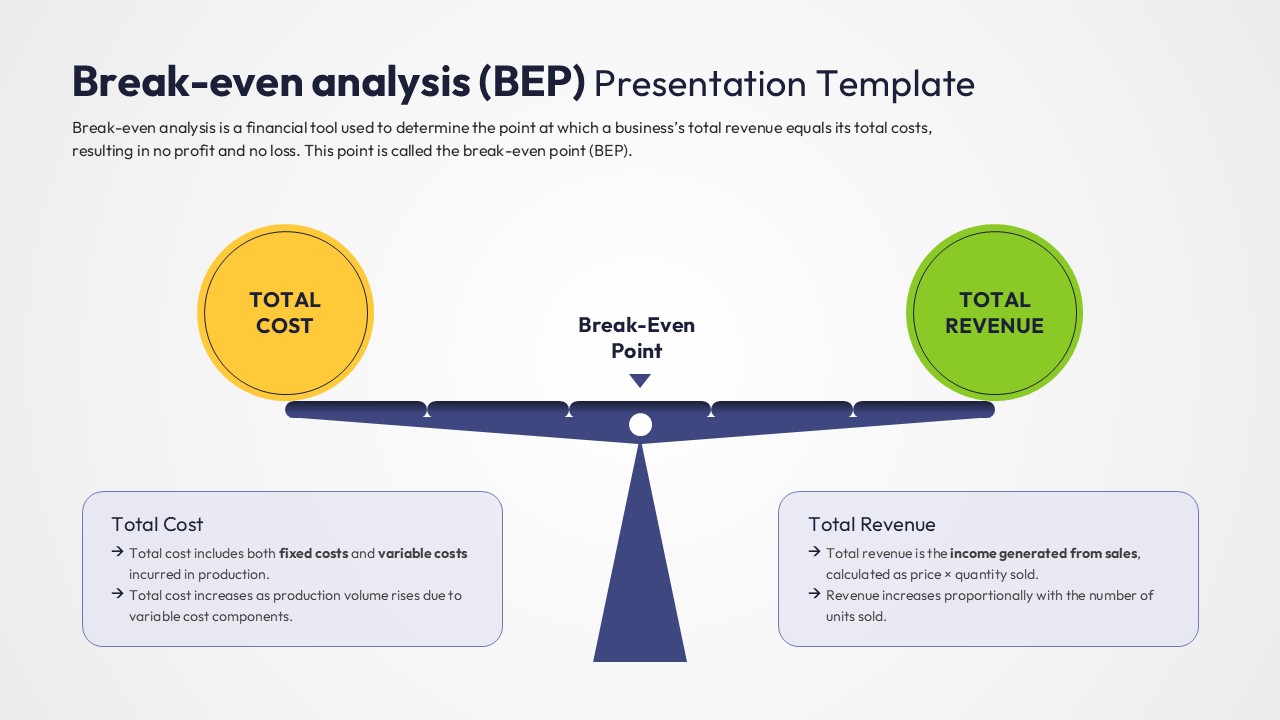
This creative infographic uses a balance scale to metaphorically represent the break-even point where costs and revenue are in equilibrium. It provides a high-level conceptual view that is perfect for introductory slides or executive summaries. The simplified design helps focus the audience on the ultimate goal of financial balance.