Data Driven Growth Infographic

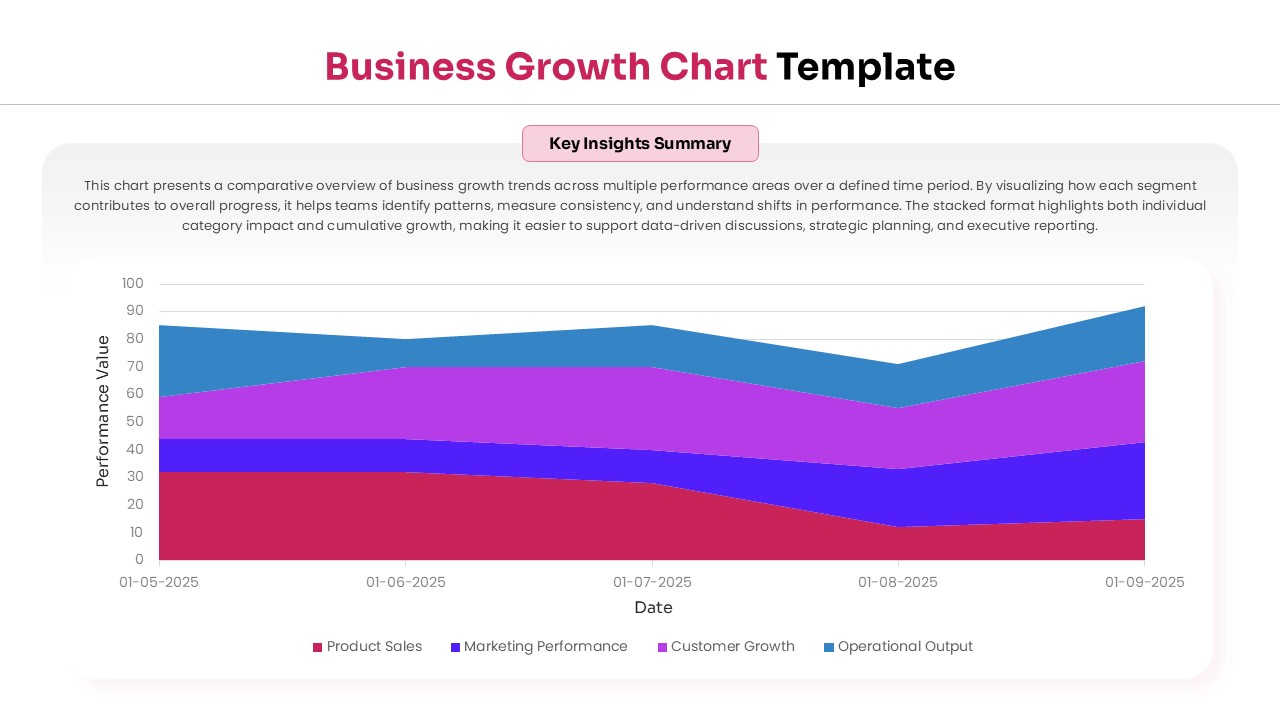
Stacked area graph slide displaying performance value trends over time for product sales and marketing

This template is part of a deck featuring multiple slides. To check out all slides.

See All
Featured image showing a collection of business growth charts including area, bar, and line graphs

Comprehensive Business Growth Metrics Presentation Template

Download this Business Growth Chart Template for PowerPoint & Google Slides to visualize your company's performance and strategic trajectory with clarity. Whether you are tracking year-over-year revenue or analyzing key growth drivers, these slides help you turn complex data into a clear story for your stakeholders. These Professional Charts & Graphs template are designed to help you look professional and prepared, allowing you to focus on the insights rather than the design, making it an essential tool for monthly reviews or annual strategy meetings.

This versatile Business Growth Chart set features several data-driven layouts, including stacked area graphs for performance trends, horizontal bar charts for growth impact scores, and clean line graphs for historical indexing. Each slide is fully editable, meaning you can easily adjust the data points, swap icons, and update the color schemes to match your brand. Using secondary metrics like operational efficiency and market expansion tracking, this template ensures every aspect of your progress is documented and easy to understand.

These Business Graphs are perfect for a variety of high-stakes environments, from boardroom executive briefings and investor pitch decks to internal department syncs and quarterly business reviews. By presenting your growth index and performance values in a structured way, you foster trust with your audience and make data-driven discussions much more productive.

Why Use these Business Chart and Graph Templates

  • Simplifies complex data into easy-to-read visual trends and growth patterns.
  • Saves hours of design time with pre-built, professional layouts.
  • Maintains high visual quality during screen sharing or large-scale projections.
  • Encourages data-driven decision-making through clear metric comparisons.

Who Should Download this Business Growth Analysis Chart

Business owners, financial analysts, project managers, and marketing leads who need to report on progress. It is also a great fit for startup founders preparing for seed funding rounds, consultants delivering performance audits, and sales directors tracking regional expansion.