Your Cart
0 Assets added
Your cart is empty.
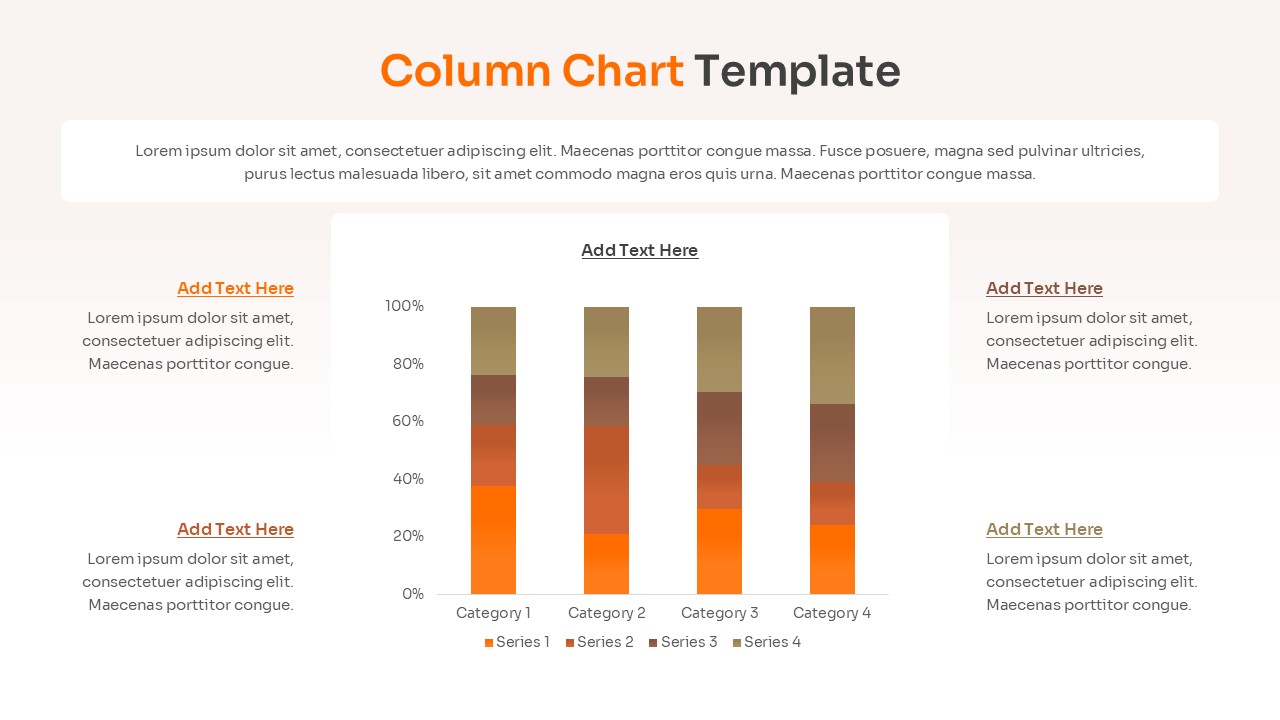
Home Professional Column Chart Template for PowerPoint & Google Slides Stacked Bar Graph Slide
Clustered bar chart layout featuring three data series and descriptive text boxes at the bottom
Product Highlights
No. of Slides
Category
Compatable With
Rating
0/5
(0 reviews)
Item ID
Author
Tags