Your Cart
0 Assets added
Your cart is empty.
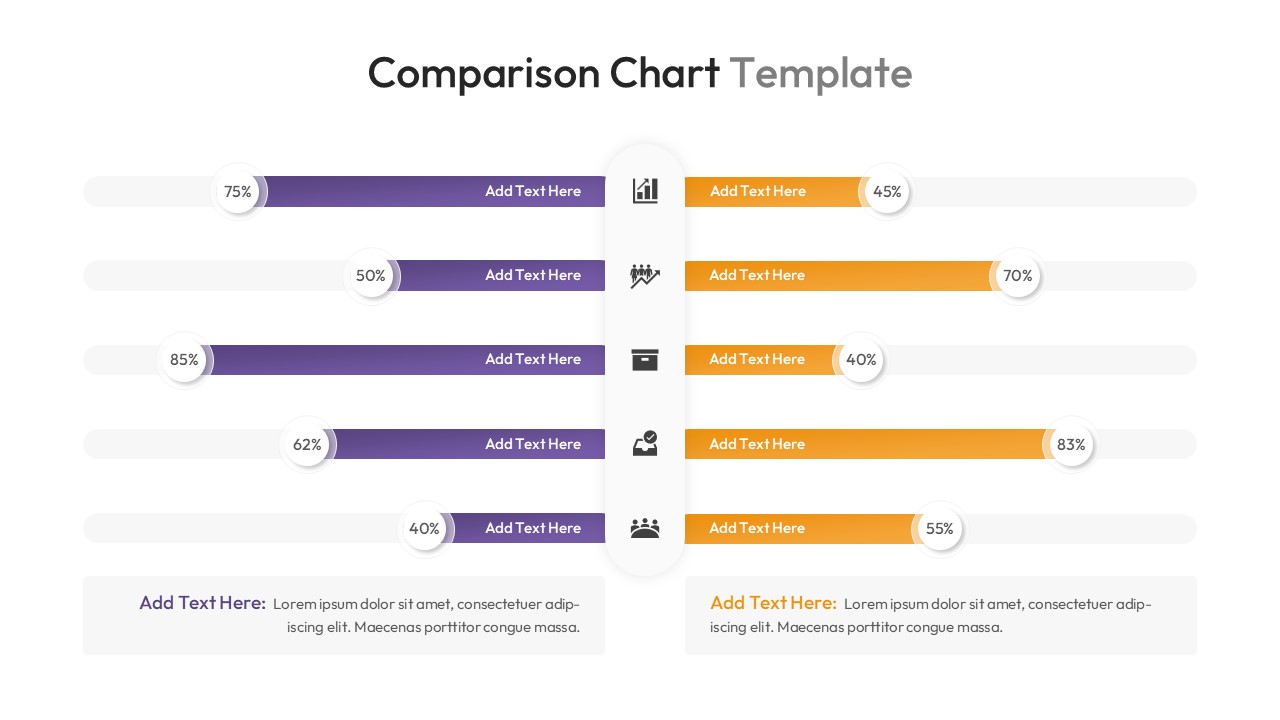
Home Comparison Chart Template for PowerPoint & Google Slides Side By Side Percentage Layout
Horizontal mirror bar chart slide comparing percentages with central icons in purple and orange
Product Highlights
No. of Slides
Category
Compatable With
Rating
0/5
(0 reviews)
Item ID
Author
Tags