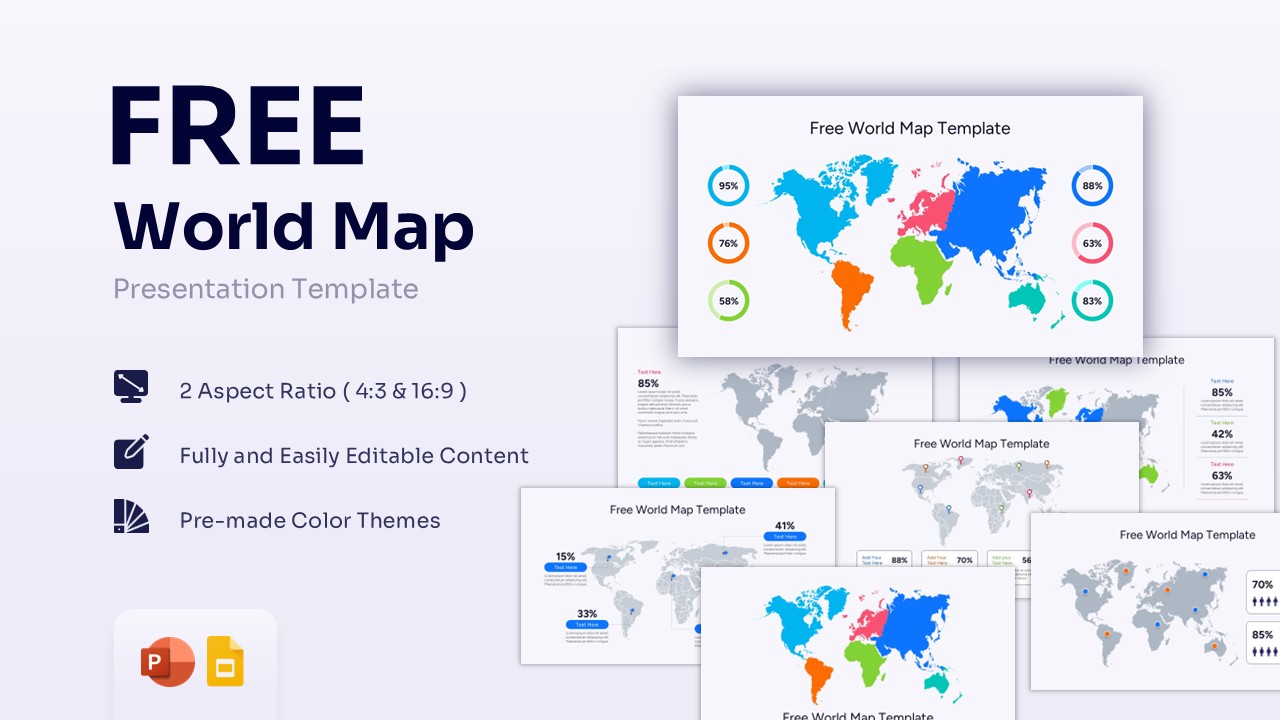
Editable USA Map Template for PowerPoint & Google Slides
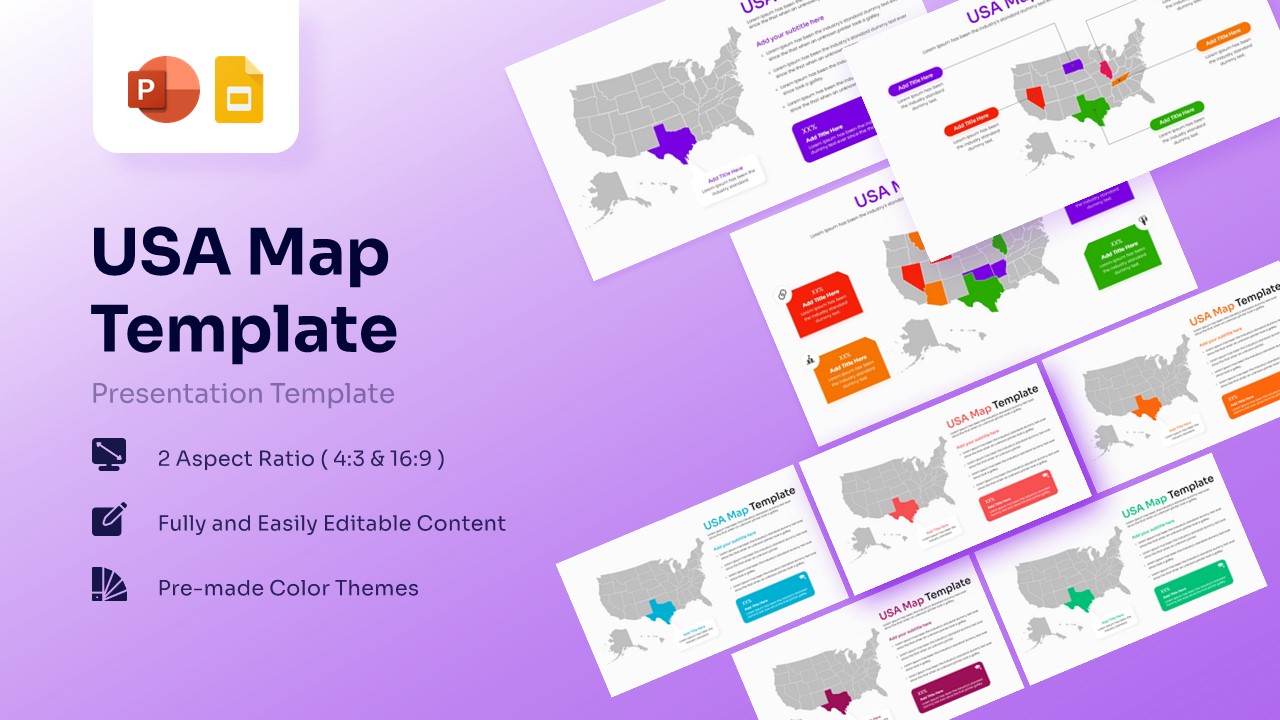


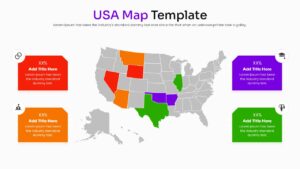
US Map Presentation Template
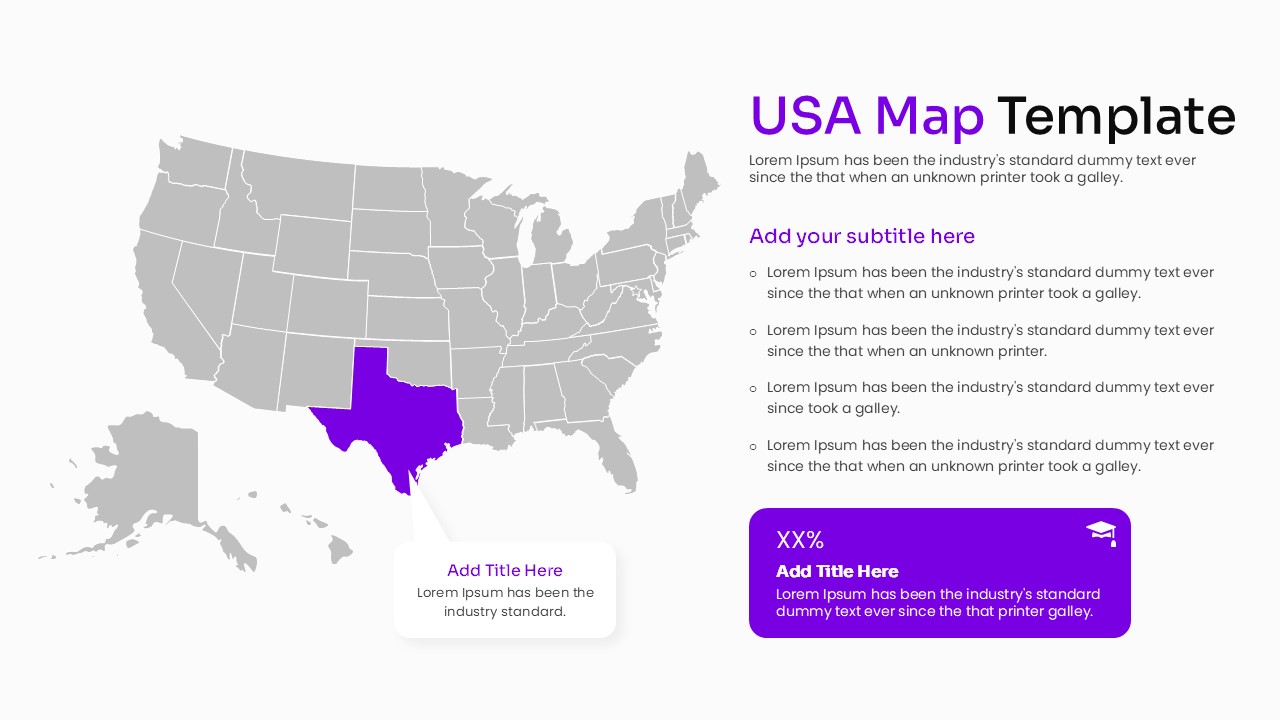
Download this USA Map Template and use case it for regional sales reporting, territory marketing strategies, or educational geography lessons. This professionally designed US Map Templates allows you to visualize geographic data across the United States with total ease and clarity. Whether you are highlighting specific states like Texas or California or providing a nationwide performance overview, these slides help you present complex location-based information clearly. It is the perfect tool for busy professionals who need to look polished in meetings without wasting time on complex design tasks.
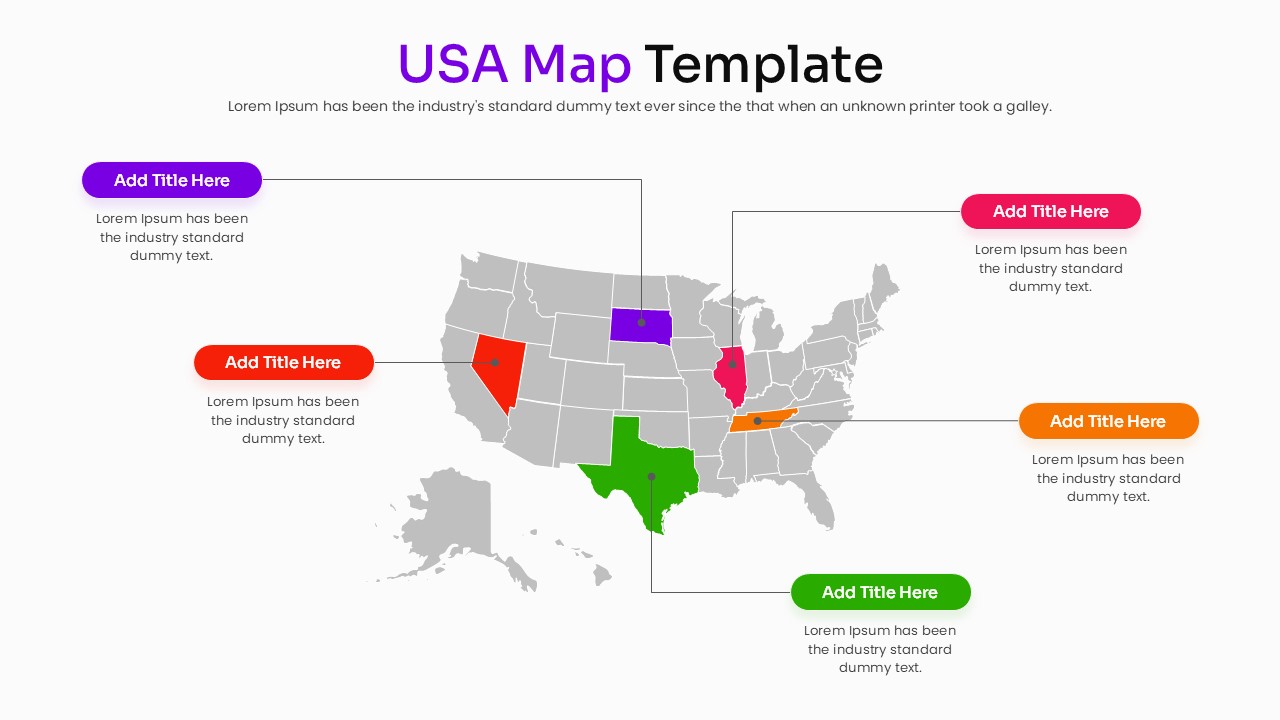
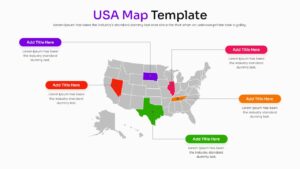
This USA Map Infographic features various layouts, including individual state highlights and multi-colored regional breakdowns. We have included pre-made color themes and callout boxes to help you pinpoint specific data points or key performance indicators (KPIs) for different territories. The template is fully editable, meaning you can change the color of any state, resize elements, and update the text to fit your specific project requirements. Using high-quality vector graphics ensures your map stays sharp and professional on any screen size.
You can use these Map Templates for a wide variety of professional and academic purposes. In a business setting, use them to track branch locations, display market share by region, or plan logistics and distribution routes. For educators, these maps are excellent for history or geography lessons. They also work perfectly for political analysis, demographic studies, and nationwide survey results. Simply pick the slide that fits your data and customize it in minutes.
Who Should Download this US Map Template
- Sales Managers tracking territory performance and regional quotas.
- Marketing Professionals mapping out campaign reach or target demographics.
- Educators and Students creating high-quality geography or history presentations.
- Business Analysts visualizing market penetration or expansion plans.
- Logistics Coordinators showing shipping routes and warehouse locations.
Why Use this US Map Infographic
- Visualize regional data instantly to make better business decisions.
- Save hours of design time with pre-built, professional map layouts.
- Highlight specific states or regions to focus your audience’s attention.
- Professional appearance ensures you feel confident and prepared for your deck.
- Easy customization allows anyone to edit colors and text with zero design skills.
Key Features
- 100% Vector-Based Graphics
- Fully Layered & Organized
- Multi-Platform Support
- Theme Color & Theme Font
Frequently Asked Questions
- Can I change the color of individual states?
- Yes, every state is a separate vector shape that can be colored individually.
- Does this template work with Google Slides?
- Absolutely, it is fully optimized for both PowerPoint and Google Slides.
- Are the aspect ratios adjustable?
- We provide both 4:3 and 16:9 versions to match any projector or monitor.
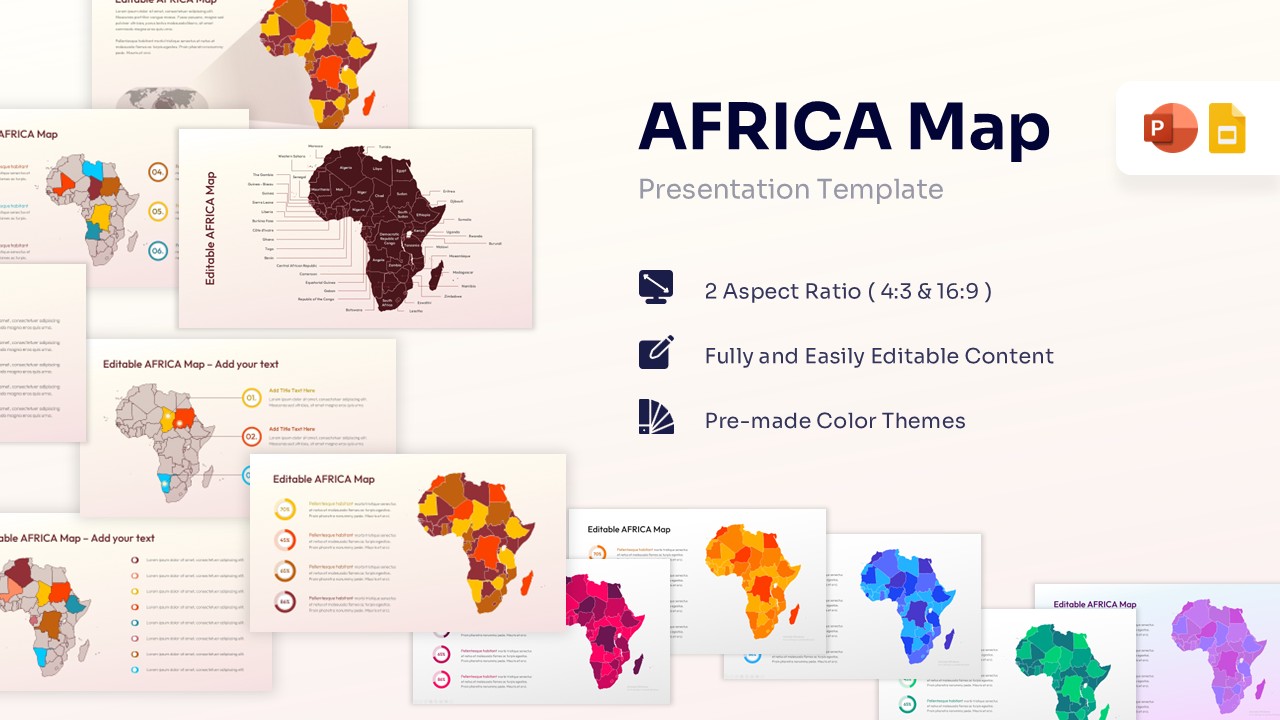
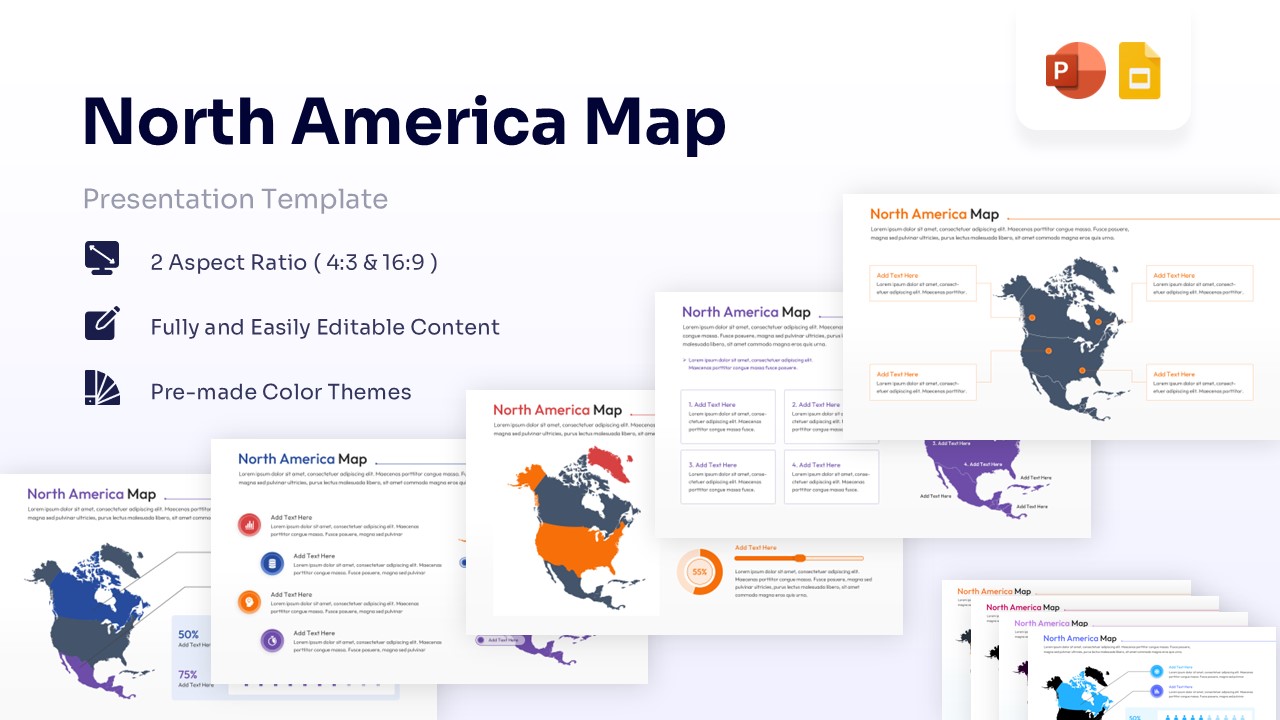
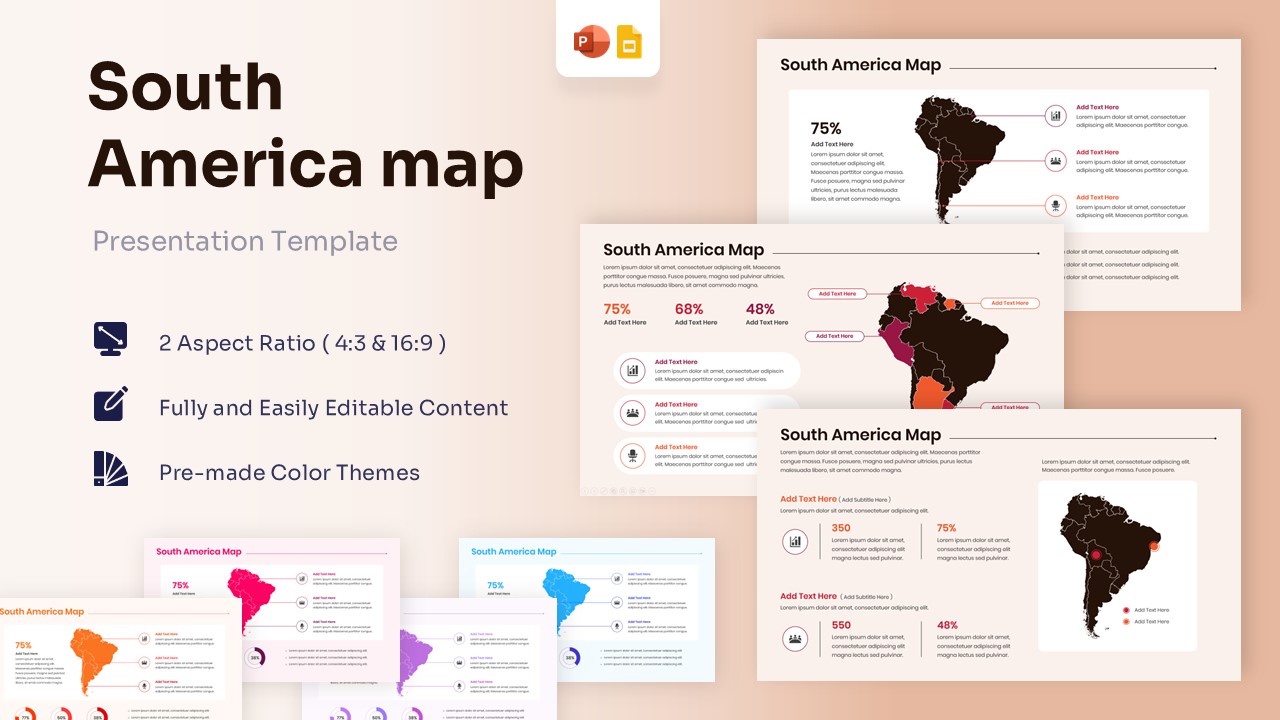
Related Templates
-
 $4.99
$4.99 -
-
 $2.99
$2.99 -
 Free
Free