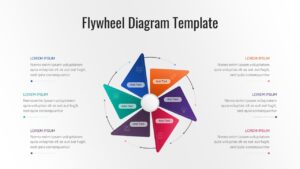
Flywheel Diagram Presentation Template for PowerPoint & Google Slides


Flywheel Presentation Templates
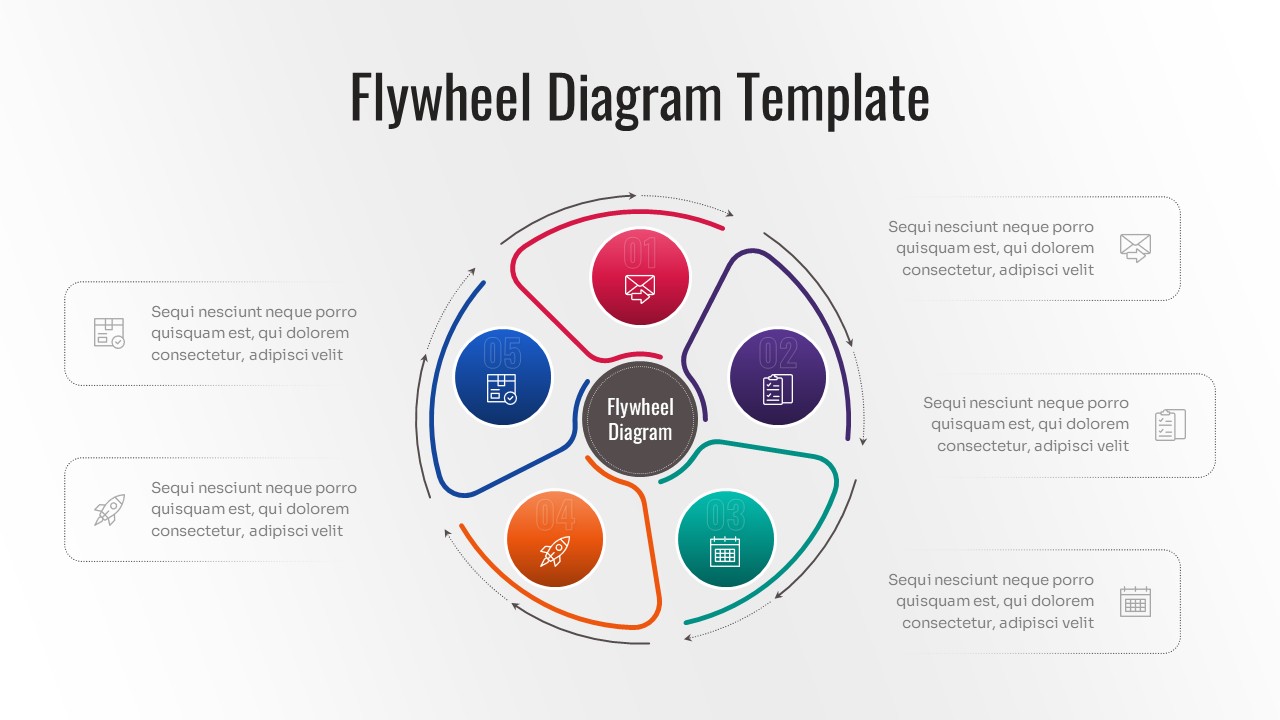
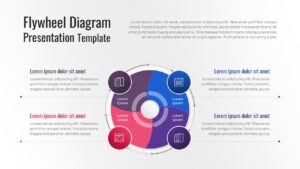
Download this Flywheel Diagram for PowerPoint and Google Slides and use case as a powerful tool to illustrate continuous momentum and self-sustaining business growth. This versatile circular diagram template helps you visualize how different forces within your organization—like marketing, sales, and customer service—interact to create a compounding effect that drives your company forward. Whether you are explaining the Amazon flywheel effect or a custom internal process, these layouts ensure your audience understands the cyclical nature of your strategy.
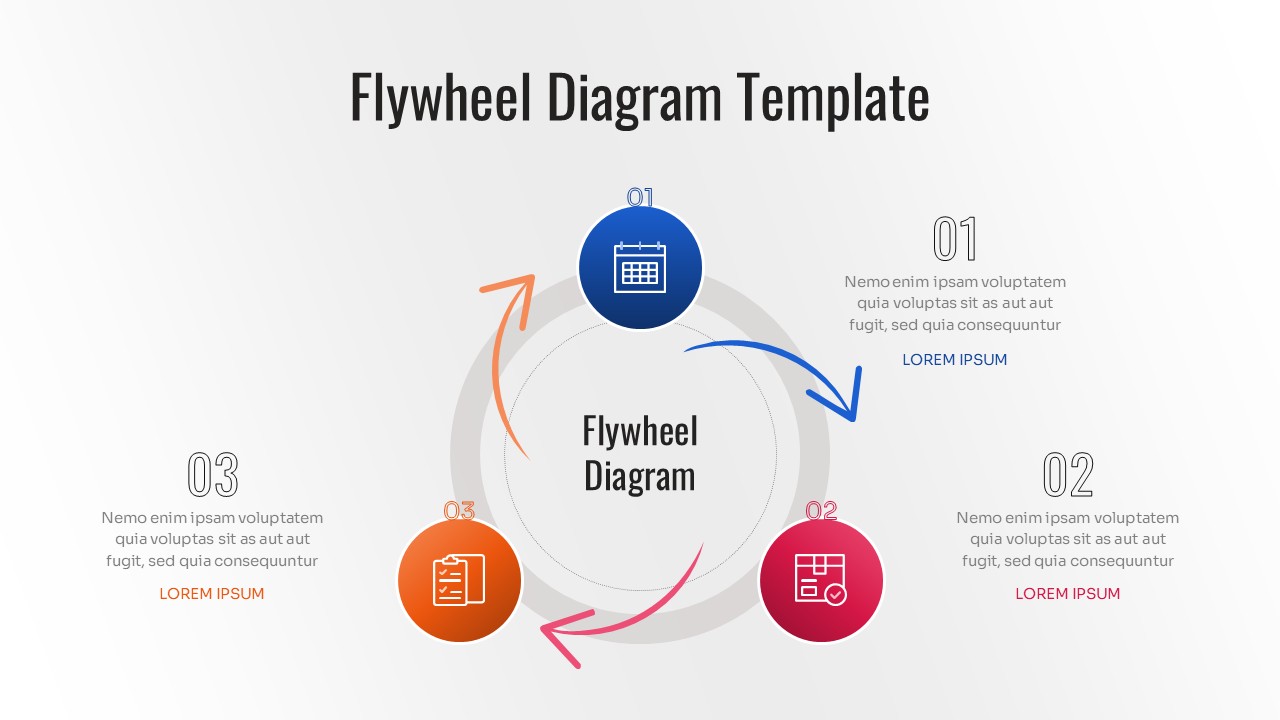
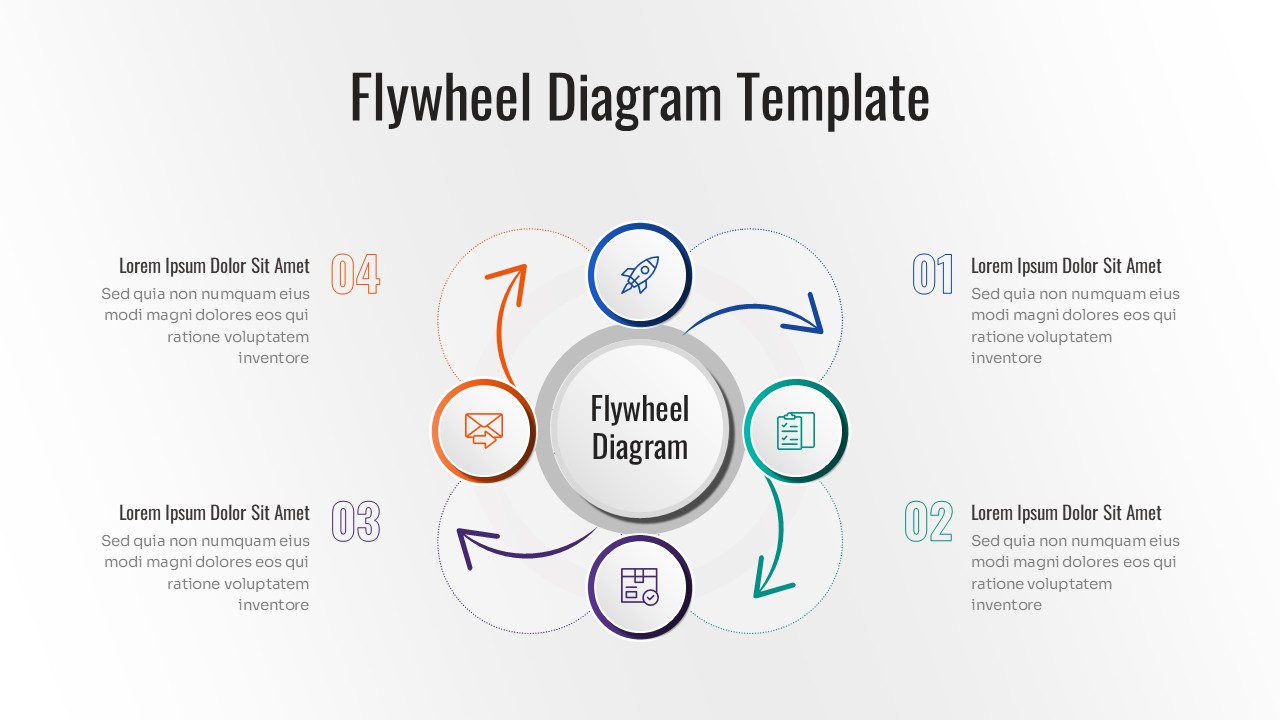
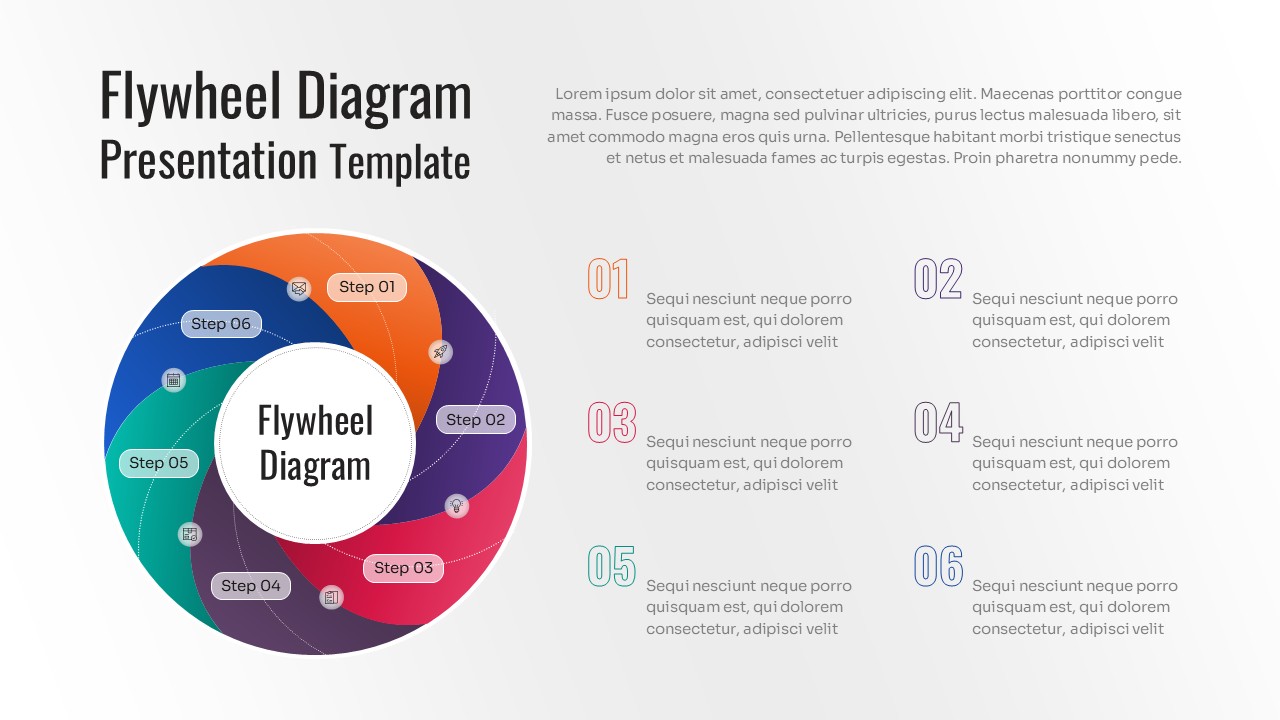
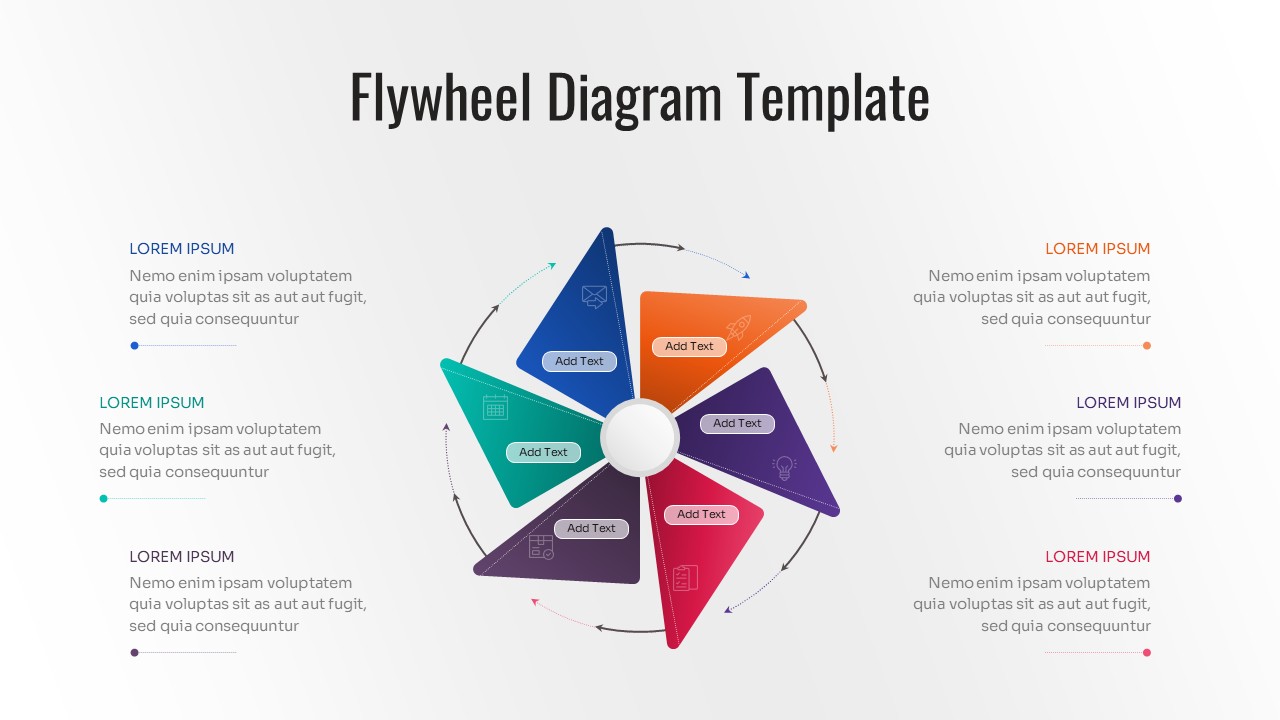
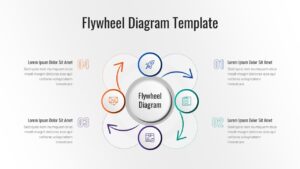
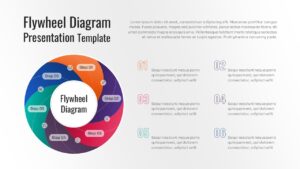
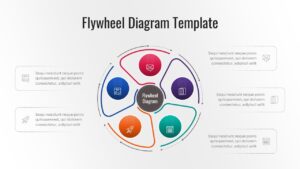
This professional flywheel infographic features a variety of circular process designs, including 3-stage, 5-stage, and 6-stage wheel diagrams. Each slide is crafted with high-quality vector graphics, allowing you to scale elements without losing clarity. The clean aesthetic and logical flow of the circular arrows help viewers track the transition from one phase to the next, making it an ideal choice for high-stakes executive briefings or internal training sessions where clarity is paramount.
Beyond basic business models, these templates are perfect for visualizing life cycles, feedback loops, and repetitive workflows across various industries. You can use these flywheel PowerPoint template to map out customer journey stages, product development cycles, or even supply chain rotations. The intuitive design allows you to highlight specific segments of the wheel to focus on particular KPIs or bottlenecks, ensuring your presentation remains dynamic and responsive to your data.
Why Use these Flywheel Diagrams
- Illustrates compounding growth and business momentum clearly.
- Simplifies complex cyclical processes into digestible visual steps.
- Saves hours of design time with pre-configured circular layouts.
- Ensures a polished, corporate look for strategic planning meetings.
Who Should Download these Flywheel Template
- Business strategists and growth hackers mapping out momentum-based models.
- Marketing managers explaining the inbound flywheel and customer retention loops.
- Operations leads visualizing supply chain cycles or quality control loops.
- Educators and students presenting on economic cycles or biological life cycles.
Key Features
- 100% Vector-Based Graphics
- Fully Layered & Organized
- Multi-Platform Support
- Theme Color & Theme Font
Frequently Asked Questions
- What is the core benefit of using a flywheel diagram over a traditional funnel?
- While a funnel sees the customer as an \"end result,\" the flywheel places them at the center, showing how happy customers drive energy back into the business to fuel further growth.
- Are the icons in this template customizable?
- Yes, all icons are vector-based. You can easily resize them, change their colors, or replace them with your own brand-specific icons without losing quality.
- Can I use these slides for a 4-step process even if the image shows 6?
- Absolutely. These templates are fully editable, so you can add or remove segments to perfectly match the number of steps in your specific business process.
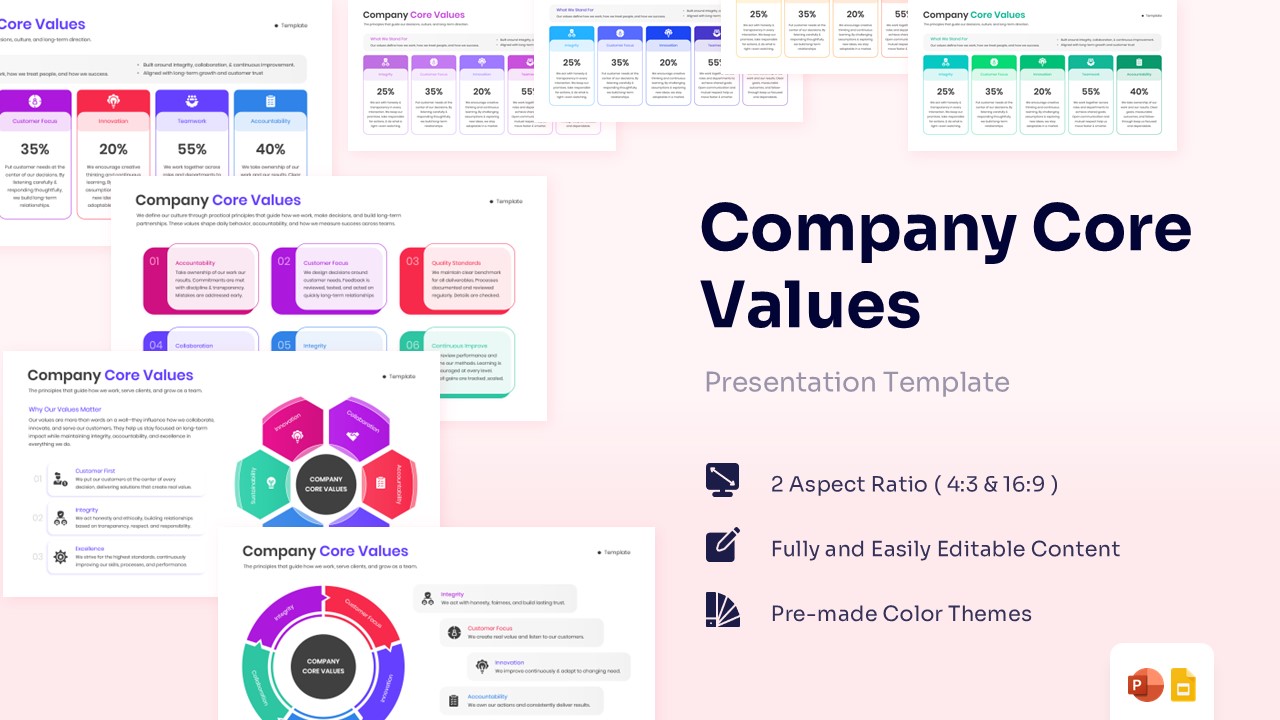
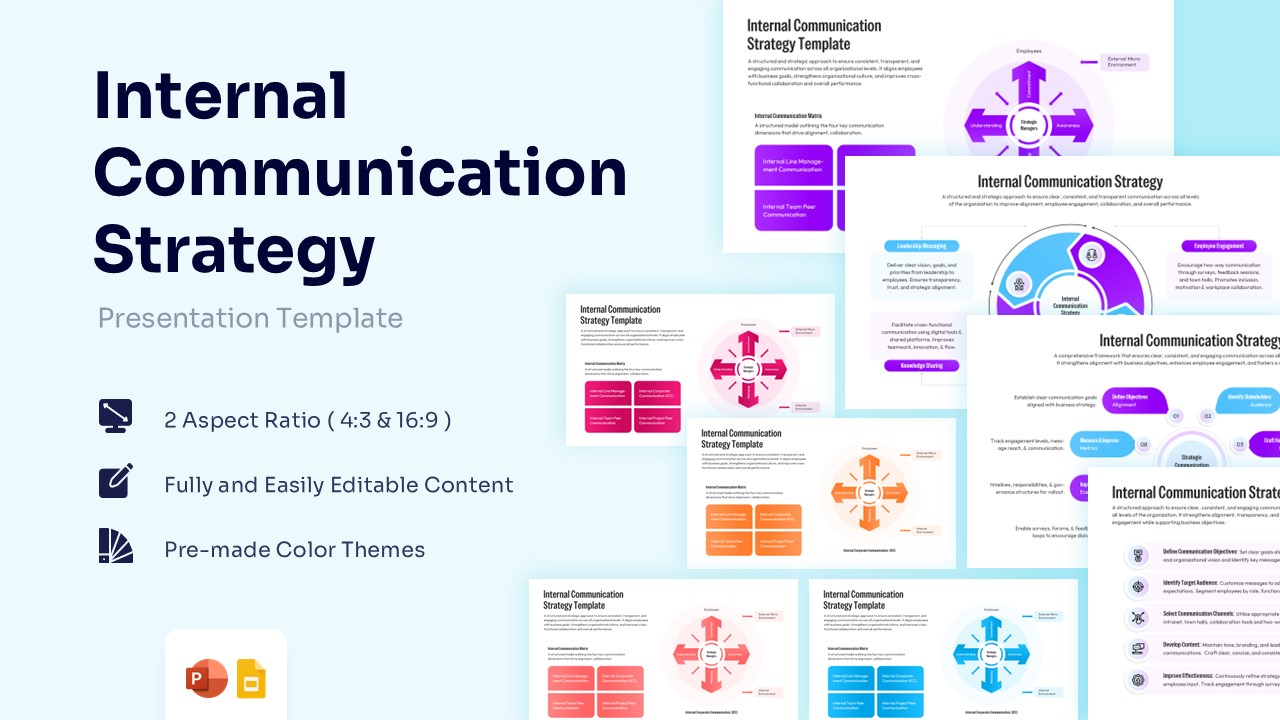
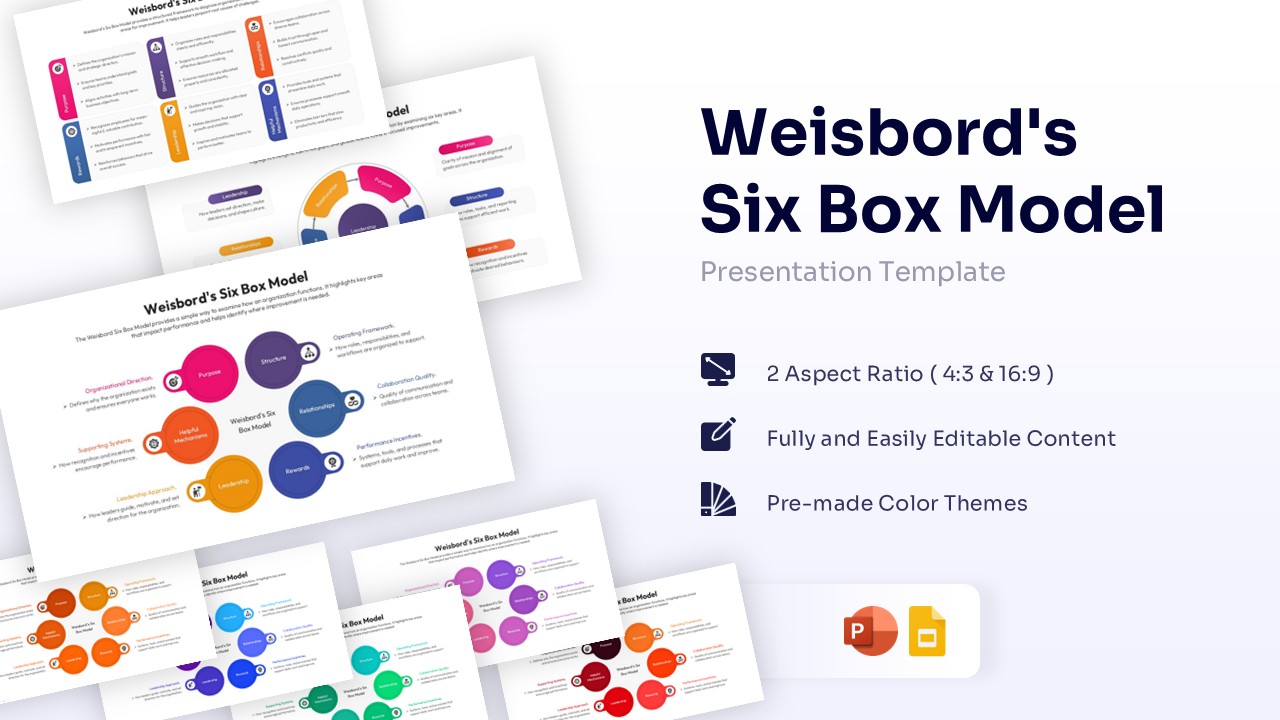
Related Templates
-
-
-
-
 $3.99
$3.99