Your Cart
0 Assets added
Your cart is empty.
Home Free Bar Chart Infographic Template for PowerPoint & Google Slides Data Visualization Infographic Templates
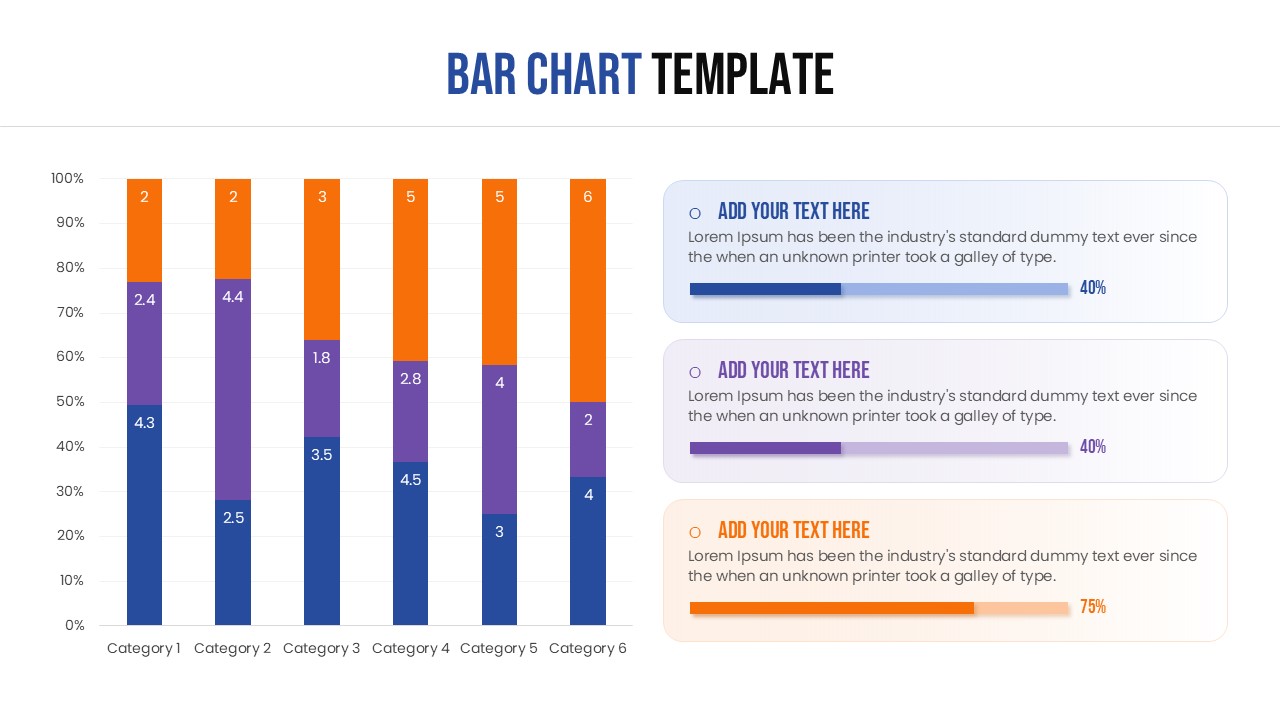
Close-up of a stacked percentage bar chart with blue, purple, and orange segments for categorical comparison
Product Highlights
No. of Slides
Category
Compatable With
Rating
0/5
(0 reviews)
Item ID
Author
Tags