Circular Process Donut Graph
This template is part of a deck featuring multiple slides. To check out all slides.
See All
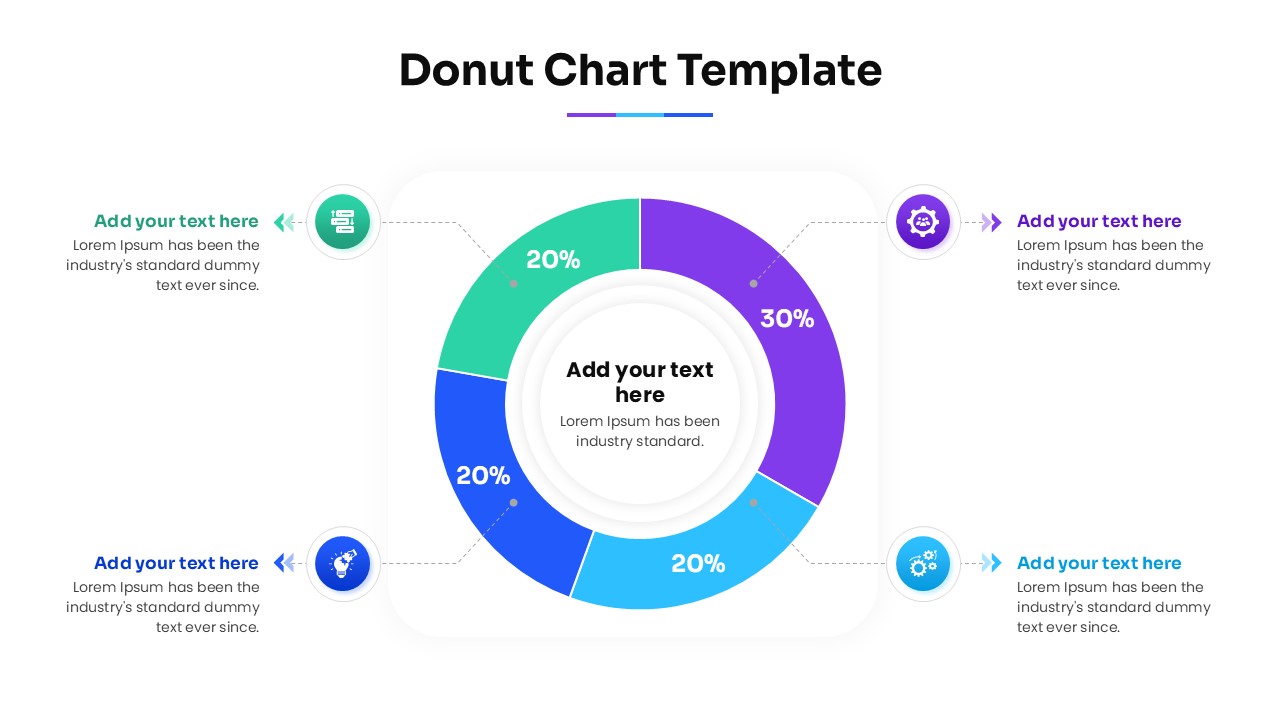
Data Visualization Donut Chart Presentation Template
Download this Donut Chart Template and use it to transform complex data sets into clear, professional visuals that your audience can understand at a glance. Whether you are presenting financial results, market share, or project progress, these chart & graph slides help you break down percentages into a clean, circular format. Using a donut chart instead of a traditional pie chart provides extra space in the center for a main heading or a key takeaway, making your data feel more organized and modern.
This Donut Chart is designed with flexibility in mind, featuring various layouts like a single large chart with side descriptions or multiple mini-charts for comparing different data points side-by-side. The template uses a professional color palette to distinguish segments clearly, ensuring that your stakeholders can follow your logic without getting lost in the numbers. It is a reliable choice for anyone who needs to deliver a polished report quickly.
You can use these free donut chart slides in a wide range of scenarios, from monthly business reviews and marketing performance reports to educational lectures and non-profit impact summaries. They work perfectly for showing demographic breakdowns, budget allocations, or survey results. Because the graphics are fully editable, you can easily adjust the segment sizes and colors to match your specific data and brand guidelines in just a few clicks.
Why Use this Doughnut Chart Template
- Visualizes percentage-based data with high clarity and professional style.
- Simplifies complex information to help your audience make faster decisions.
- Offers a modern alternative to standard pie charts with centered text options.
- Saves hours of design time with pre-configured layouts and balanced white space.
- Ensures consistent quality across both PowerPoint and Google Slides platforms.
Who Should Download Donut Chart Infographic
Business analysts, project managers, and marketing executives who need to present data-driven insights. It is also an excellent resource for educators, students, and consultants who want to create a polished, expert look for their presentations. Whether you are leading a small team meeting or speaking at a large conference, this template helps you stay in control of your message.