Root Cause Analysis Fishbone Diagram Template for PowerPoint & Google Slides


Ishikawa Cause and Effect Presentation Template
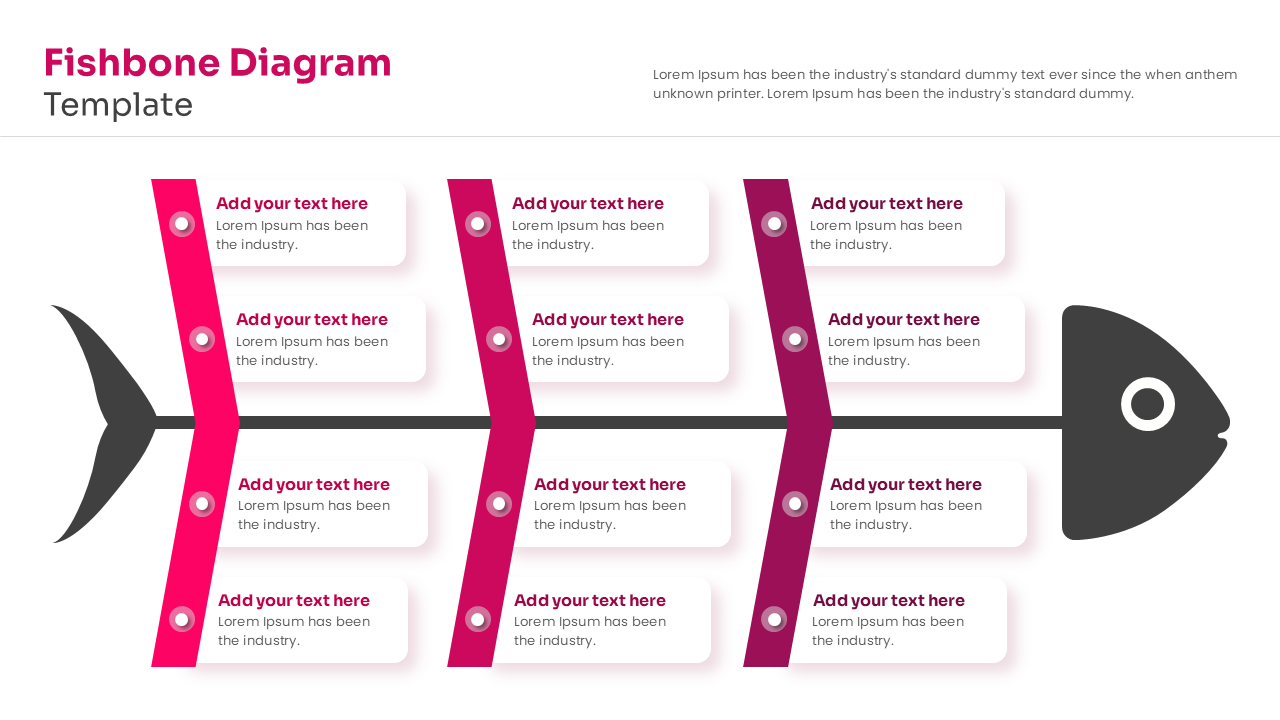
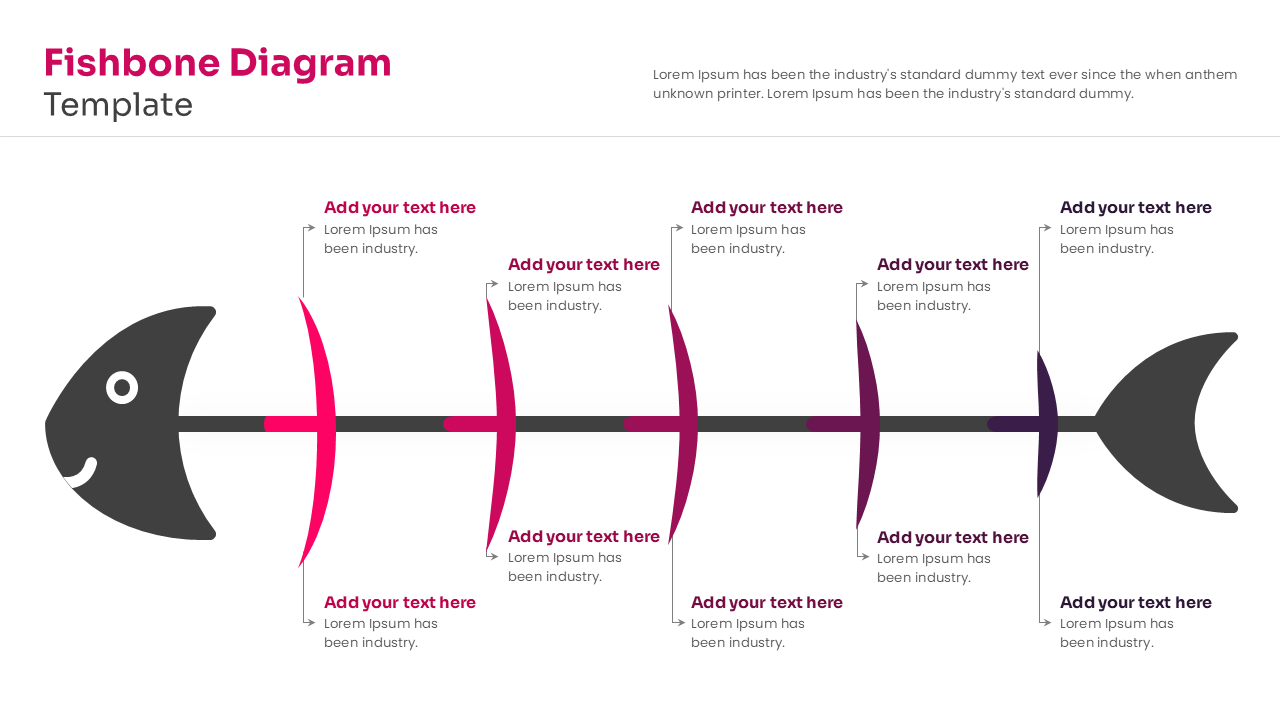
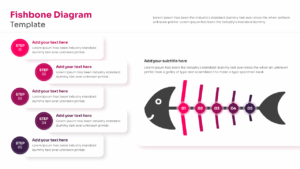
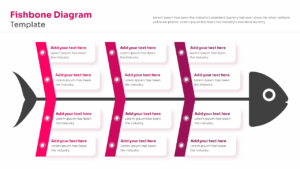
Download this Fishbone Diagram Template to visually map out the root causes of complex problems and find effective solutions. This cause and effect diagram tool allows you to look beyond surface-level symptoms and organize contributing factors into clear categories, ensuring your team focuses on what really matters. Whether you are leading a brainstorming session or presenting a quality report, this slide helps you communicate your findings with clarity and confidence.
This Ishikawa Template inspired layout features a clean, professional structure with editable spines for categorizing causes like people, methods, machines, and materials. The design guides the audience naturally from the detailed inputs on the left to the main effect on the right, making the logic easy to follow. With customizable colors, fonts, and icons, you can quickly adapt the Cause and Effect chart to match your brand style without spending hours on design.
These mind map fishbone templates are perfect for a wide range of professional scenarios, including manufacturing process improvements, software bug tracking, and healthcare safety audits. You can also use them in educational workshops to teach critical thinking or in project management meetings to analyze risks. By visualizing the connection between different variables, you help stakeholders understand the full picture and drive faster, data-backed decision-making.
Why Use this Fishbone Template
- Simplifies complex Root Cause relationships into a single, easy-to-read visual.
- Encourages structured brainstorming by categorizing potential issues efficiently.
- Helps teams focus on solutions rather than getting lost in the details of the problem.
- Saves time on design, allowing you to focus on the analysis and strategy.
Who Should Download this Fishbone Analysis Template
- Project Managers who need to identify and present bottlenecks to stakeholders.
- Quality Assurance Teams tasked with analyzing product defects or software bugs.
- Business Analysts looking to map out process inefficiencies visually.
- Educators & Trainers teaching critical thinking or problem-solving methodologies.
Key Features
- 100% Vector-Based Graphics
- Fully Layered & Organized
- 2 Aspect Ratios (4:3 & 16:9)
- Fully and Easily Editable Content
- Pre-made Color Themes
Frequently Asked Questions
- What is a Fishbone Diagram used for?
- It is a visual tool used for categorizing the potential causes of a problem to identify its root causes.
- Can I change the colors of the fish spines?
- Yes, all elements in this template are fully editable, so you can match them to your company branding.
- Is this template compatible with Google Slides?
- Absolutely, this template is designed to work seamlessly in both PowerPoint and Google Slides.
Related Templates
-
 $2.99
$2.99 -
-
-