Your Cart
0 Assets added
Your cart is empty.
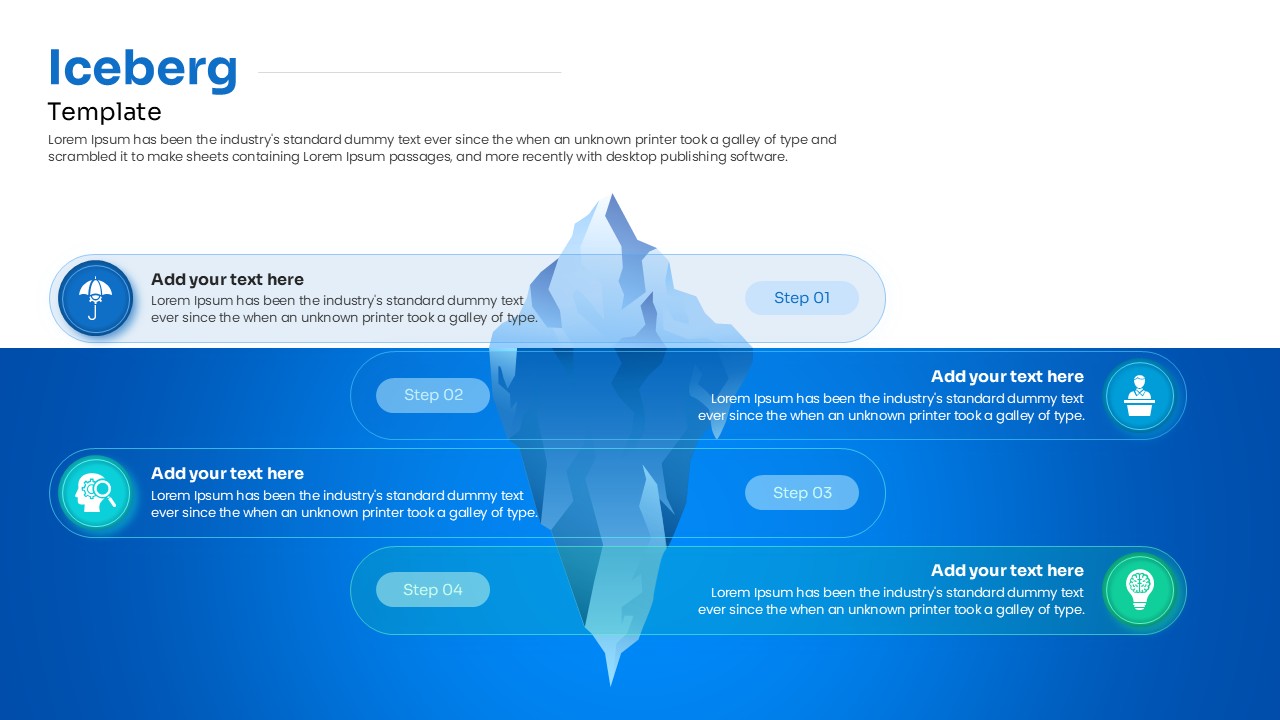
Home Free Creative Iceberg Template for PowerPoint & Google Slides ROOT CAUSE ANALYSIS ICEBERG DIAGRAM
Comparison slide showing 40% tip of the iceberg versus 60% underwater mass
Product Highlights
No. of Slides
Category
Compatable With
Rating
0/5
(0 reviews)
Item ID
Author
Tags