Harvey Balls PowerPoint Template
This template is part of a deck featuring multiple slides. To check out all slides.
See All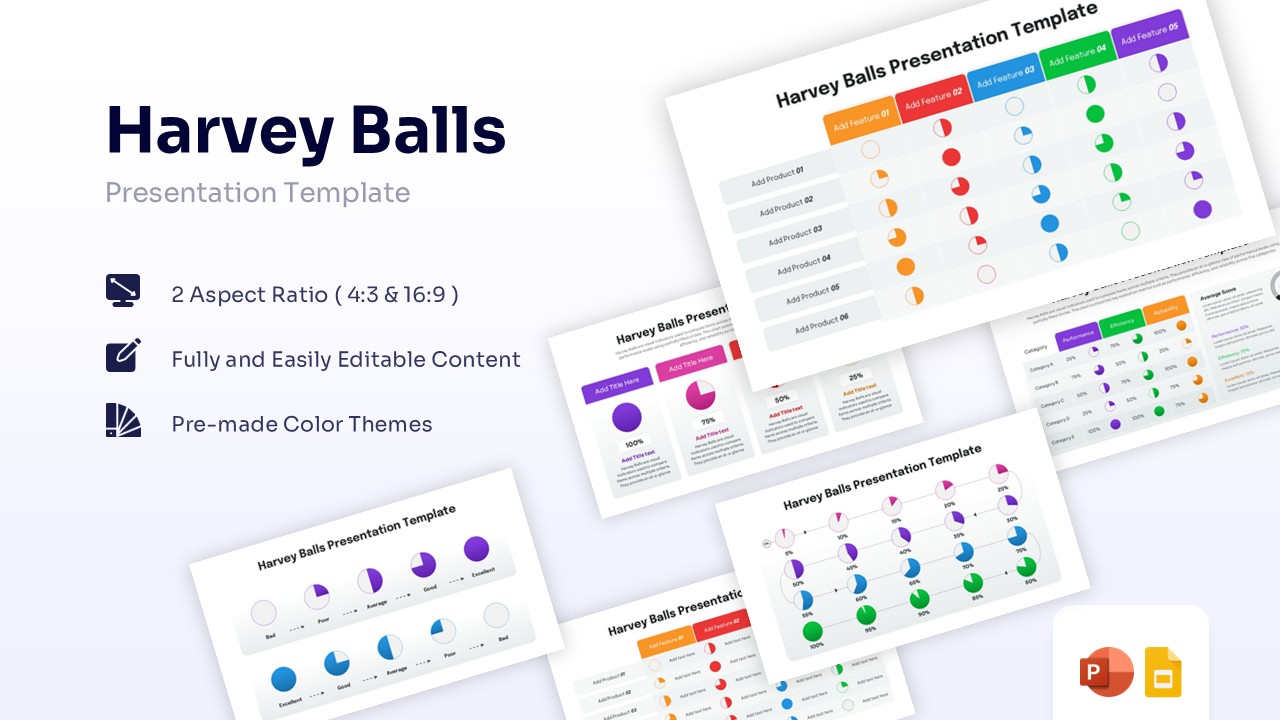
Harvey Balls Data Visualization Presentation Template
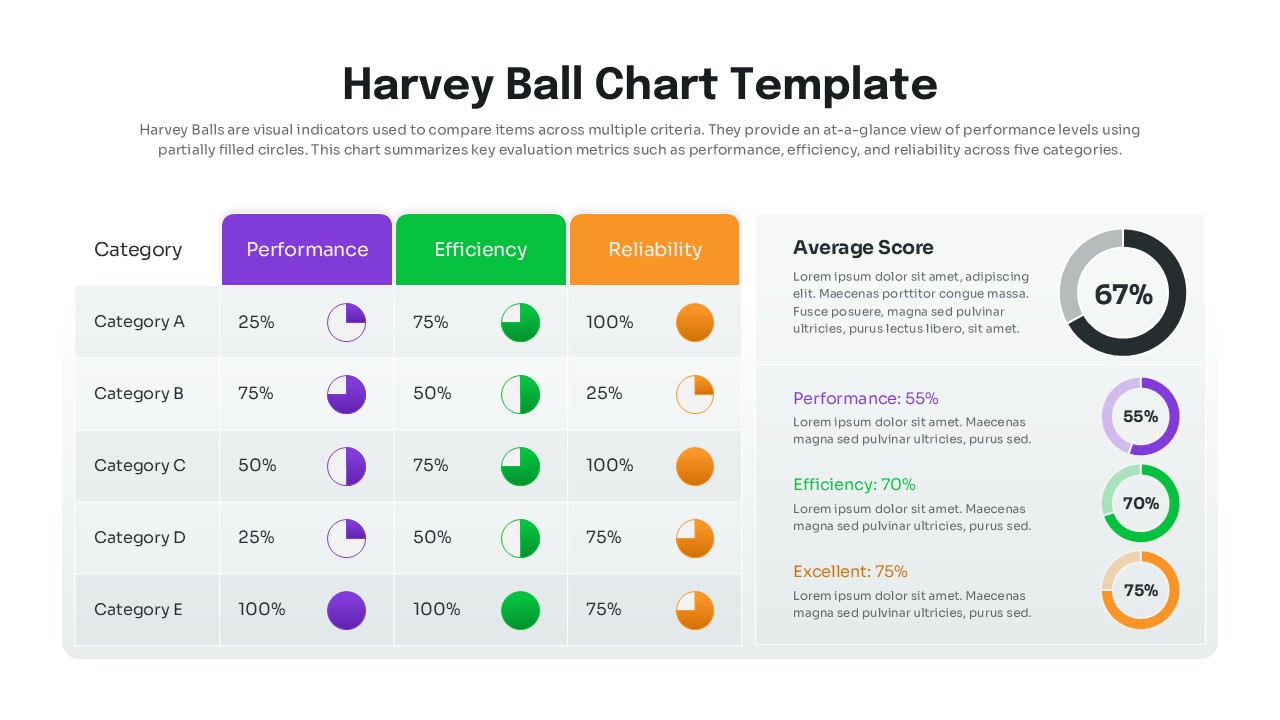
Download this Harvey Balls Template to streamline your project reporting and data comparisons across professional decks. Whether you are tracking milestone progress or comparing product features, these Harvey Ball symbols provide a clear, visual way to communicate complex qualitative data instantly. This easy to edit charts and graphs helps busy professionals present status updates that are easy to read and look polished in any boardroom setting, ensuring your audience understands project health at a single glance.
Our Harvey Balls PowerPoint template features a variety of layouts, including comparison tables, feature lists, and progress grids. Each Harvey Ball is fully editable, allowing you to adjust the fill levels to represent various completion stages or quality ratings. The clean, modern design ensures that your data remains the hero of the slide while maintaining a professional aesthetic that fits seamlessly into corporate or startup environments.
These templates are incredibly versatile for diverse business scenarios and reporting needs. Use them for vendor evaluations to show which software meets your requirements best, or in quarterly reviews to indicate the completion status of team goals. They are also perfect for project managers who need to give a quick "at-a-glance" update on various workstreams without overwhelming the audience with dense text or complex spreadsheets.
Why Use this Harvey Balls Template
- Saves hours of design time by providing pre-made, professional Harvey Ball layouts.
- Improves slide readability by replacing bulky numbers with intuitive visual symbols.
- Maintains brand consistency with easily customizable colors and fonts.
- Ensures a polished look with high-quality graphics that never pixelate on large screens.
- Facilitates faster decision-making by highlighting gaps and progress clearly.
Who Should Download this Harvey Balls Diagram
- Project Managers tracking task statuses and upcoming milestones.
- Product Managers comparing feature sets against market competitors.
- Consultants presenting qualitative assessments and project audits to clients.
- Executive teams needing a high-level overview of business KPIs.
- HR professionals evaluating employee performance or training progress.