Professional KPI Dashboard Template for PowerPoint & Google Slides


Business Performance KPI Dashboard Presentation Template
Download this KPI Dashboard Template and use case as a central hub for tracking your most critical business metrics during executive reviews or monthly team syncs. This dashboard template is designed to help you transform complex data sets into a clear, visual story that everyone in the room can understand instantly. Whether you are presenting to stakeholders or your internal department, these slides provide a structured layout to display revenue, growth, and performance indicators without overwhelming your audience.
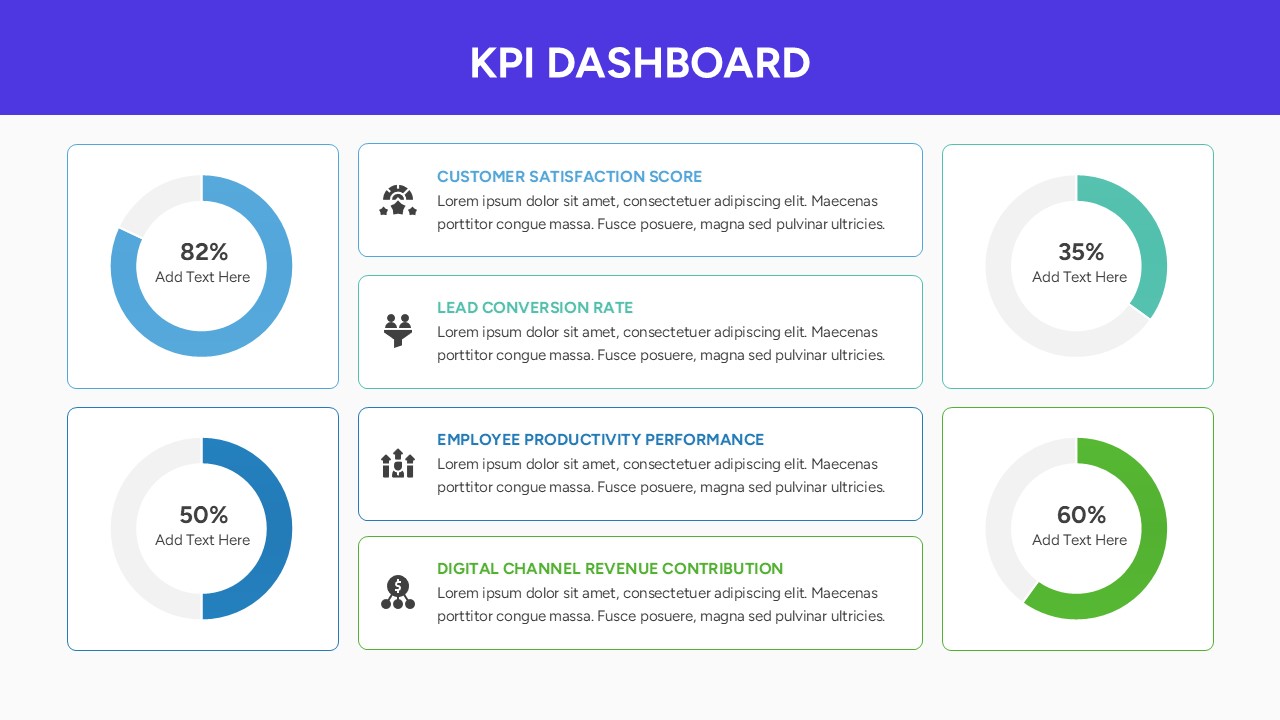
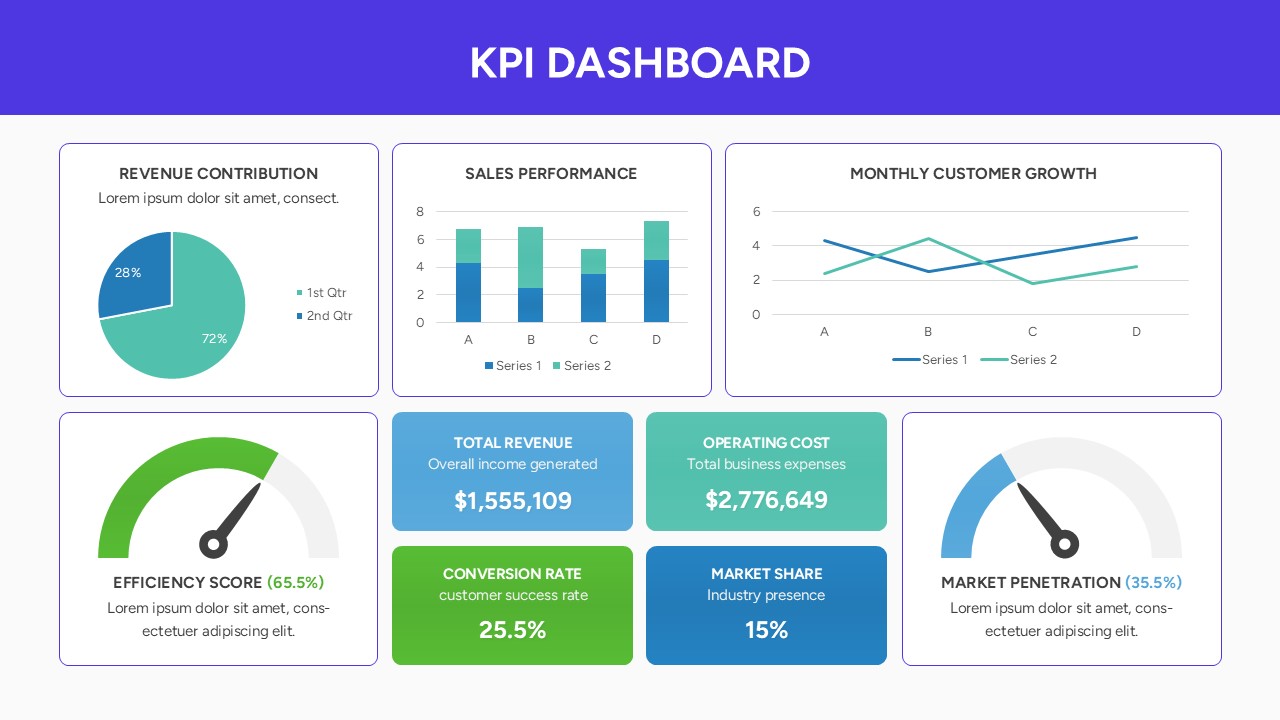
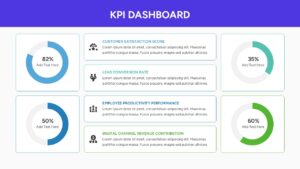
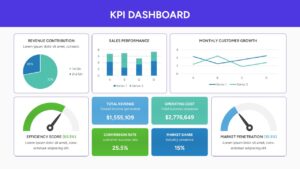
This data-driven Dashboard PowerPoint Template includes a variety of visualization tools such as line graphs for monthly customer growth, bar charts for sales performance, and donut charts for revenue contribution. We have also integrated specialized gauges like efficiency scores and market penetration meters to give your presentation a high-tech, professional feel. Using these secondary keywords like business metrics, performance tracking, and data visualization ensures your deck looks polished and remains highly functional for any corporate environment.
In a practical setting, these Dashboard Infographic Templates can be used for quarterly business reviews (QBRs), marketing campaign performance tracking, or financial health summaries. You can easily swap out the placeholder text for your specific numbers, making it an ideal choice for project managers who need to report on milestones or sales leads who need to visualize conversion rates. The clean, card-based layout ensures that even when you have multiple data points on one screen, the information remains organized and easy to digest.
Who is it for – Data Analysts and Business Managers
- Financial Analysts and Accountants: Professionals tracking revenue streams, profit margins, and quarterly budget allocations.
- Marketing Directors: Growth leads monitoring conversion rates, customer acquisition costs, and social media ROI.
- Sales Managers: Teams visualizing lead generation, individual performance targets, and regional sales distribution.
- Project Coordinators: Individuals measuring team velocity, efficiency scores, and milestone completion status.
- Startup Founders: Entrepreneurs who need a professional way to showcase growth metrics and market penetration to potential investors.
Who Should Download It – Strategic Decision Makers
- Busy Executives: Leaders who need a high-level, “at-a-glance” overview of company health without digging through raw spreadsheets.
- Business Consultants: Professionals looking for a polished, ready-made framework to present findings and recommendations to clients.
- Operations Managers: Staff responsible for monitoring internal productivity, resource utilization, and operational KPIs.
- E-commerce Specialists: Store owners tracking monthly customer growth, average order value, and platform performance.
- Human Resources: Teams reporting on employee engagement, retention rates, and internal productivity metrics.
Key Features
- 100% Vector-Based Graphics
- Fully Layered & Organized
- Multi-Platform Support
- Theme Color & Theme Font
Frequently Asked Questions
- How do I edit the data in these charts?
- Simply right-click the chart and select \"Edit Data\" to input your own numbers via the integrated spreadsheet.
- Can I change the colors to match my brand?
- Yes, the entire template is theme-color-ready, meaning a single change in the master settings updates the whole deck.
- Are the icons resizable?
- Every icon is a vector shape, so you can resize or recolor them without losing any image quality or clarity.
Related Templates
-
 $3.99
$3.99 -
-
-
 $3.99
$3.99