Map of Mexico Template for PowerPoint & Google Slides


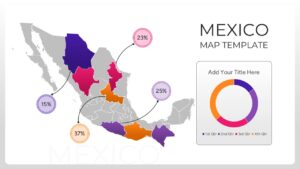
Editable Mexico Map Presentation Template
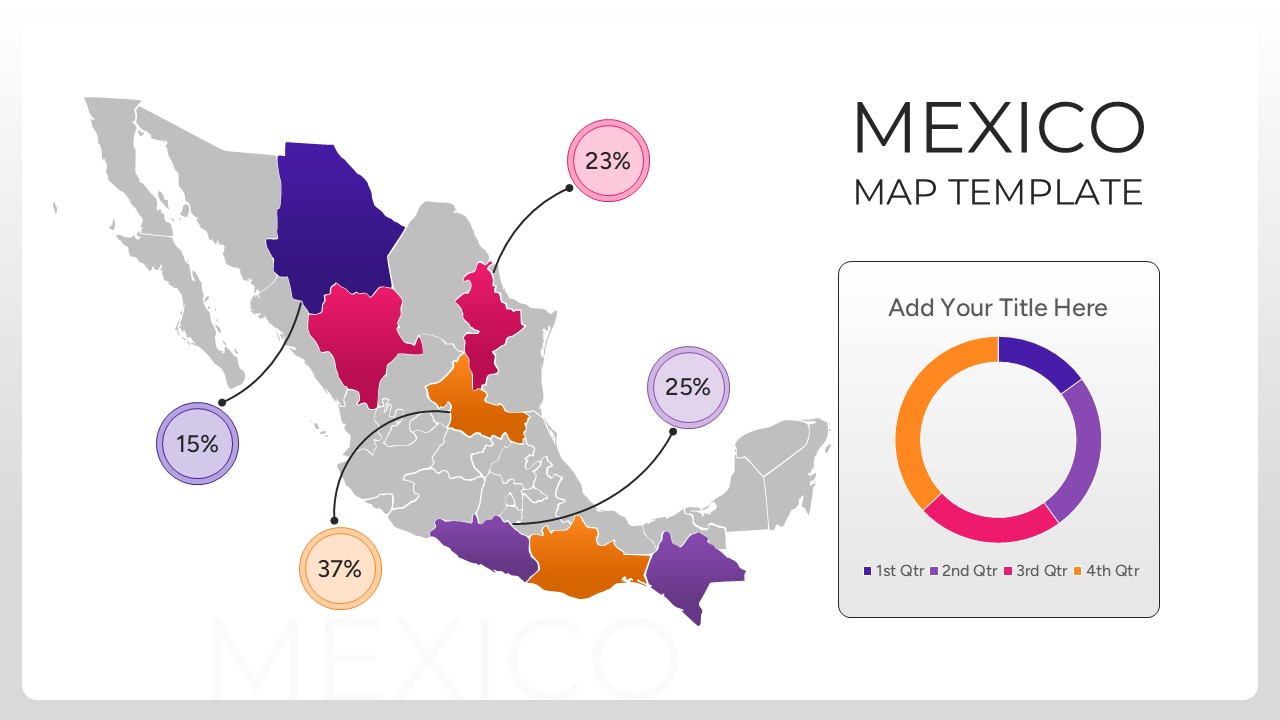
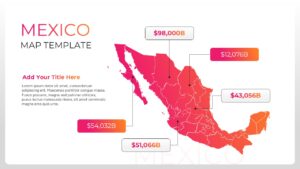
Download this Map of Mexico Template and use case as a visual anchor for geographic reporting, regional sales breakdowns, or educational presentations. This Country Map Template is designed to help professionals display complex data across different Mexican states without cluttering their slides. Whether you are pinpointing office locations or presenting demographic shifts, these layouts provide a clear, supportive framework that ensures your audience stays focused on the key insights.
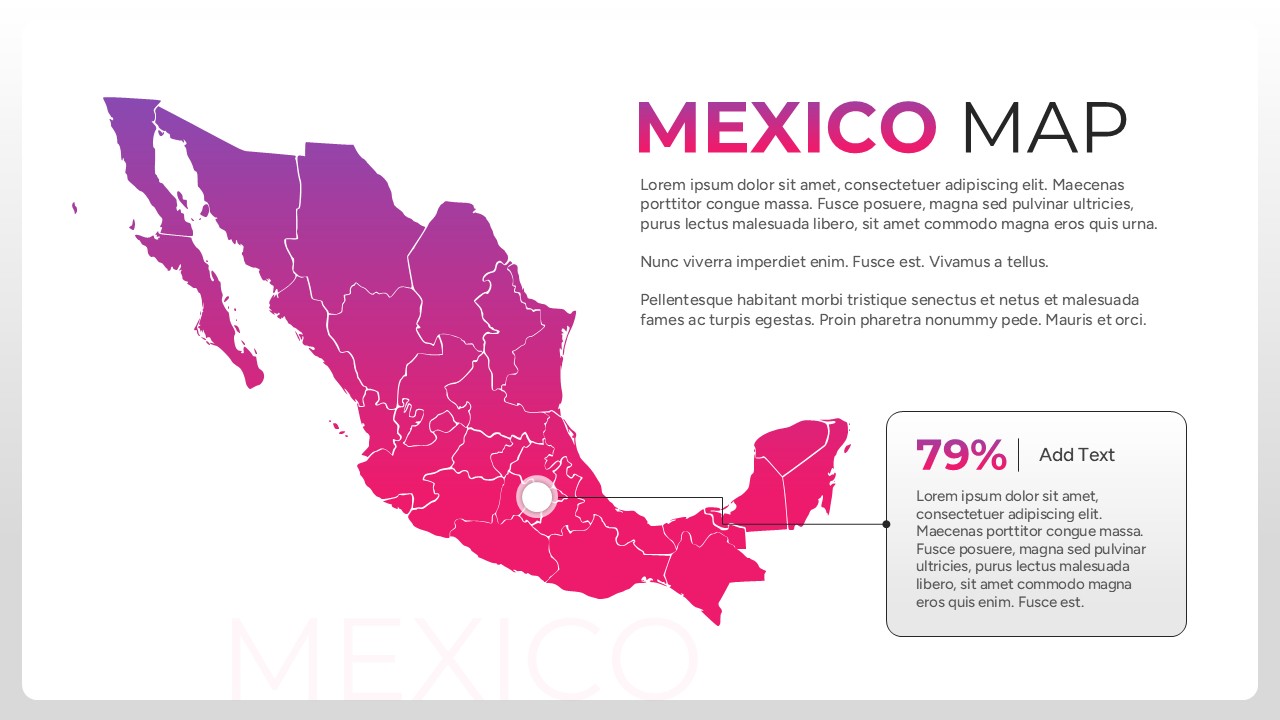
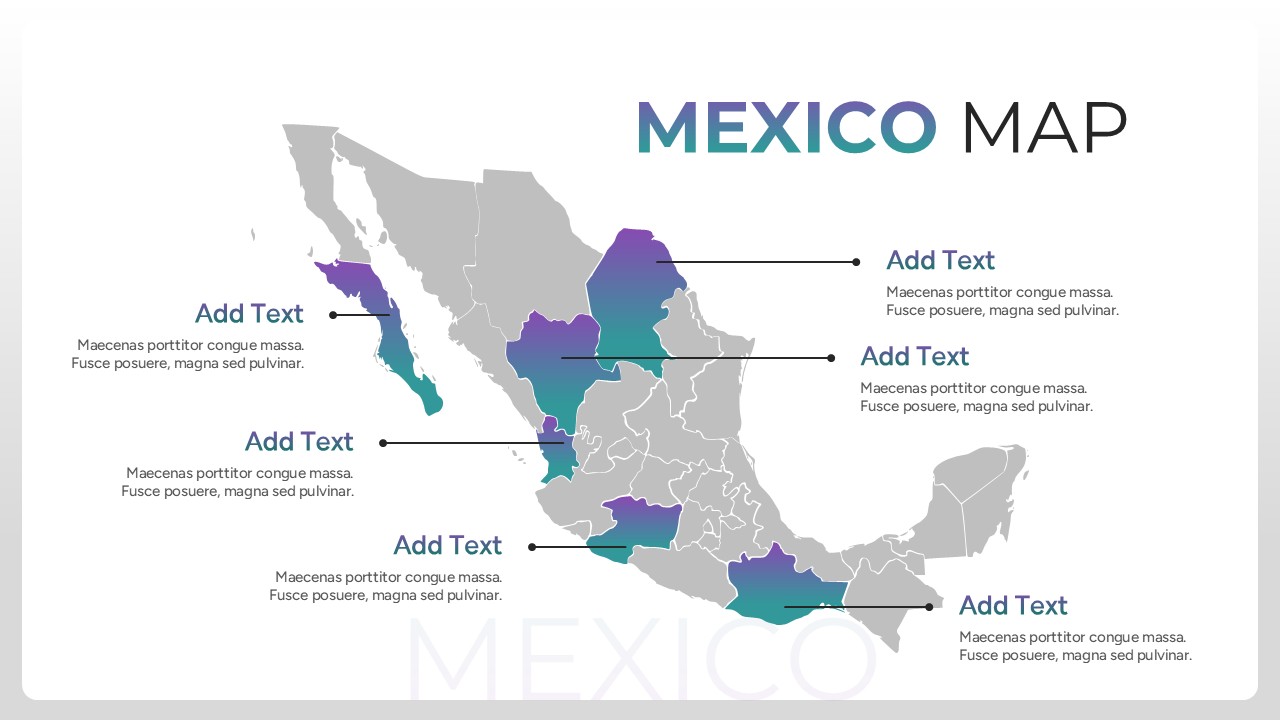
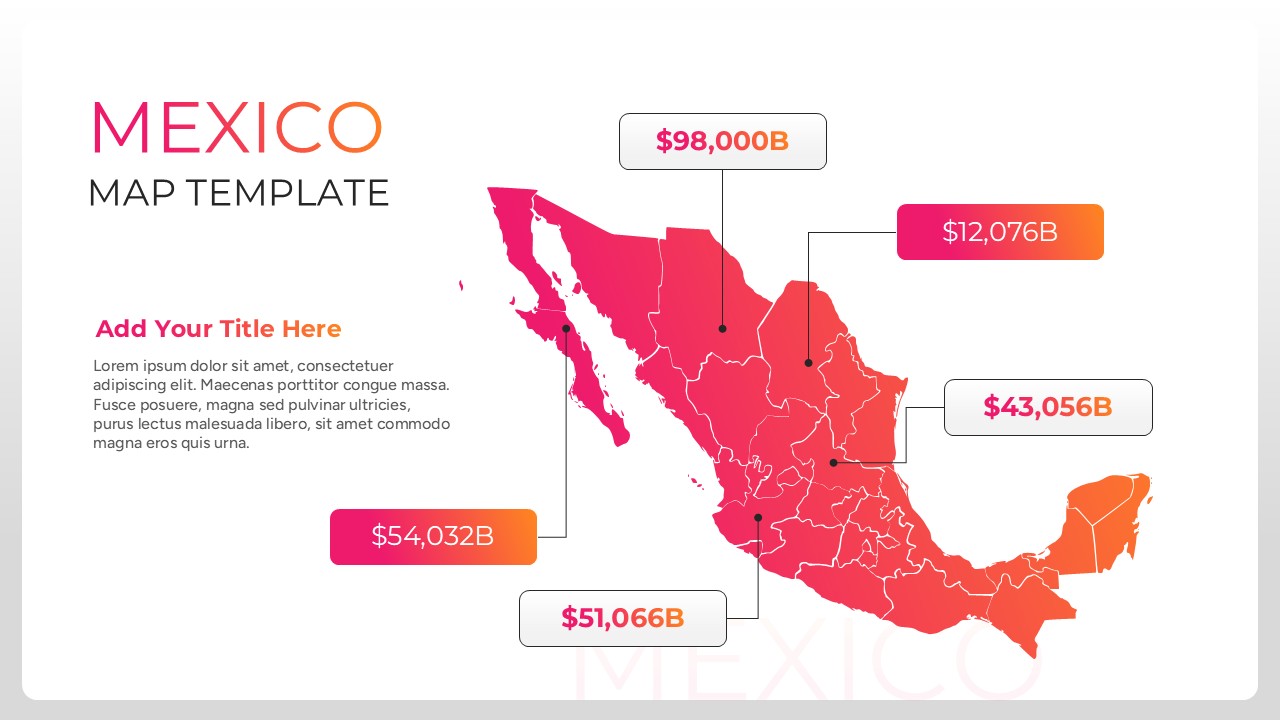
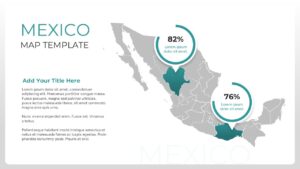
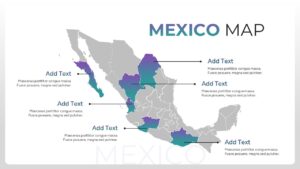
This Mexico Map Presentation Template features various high-quality layouts including heat maps, pin-point markers, and integrated data charts. By incorporating secondary keywords like regional analysis and geographic plotting, you can transform a standard map into a powerful storytelling tool. The design allows you to highlight specific states with distinct colors and call-out boxes, making it easier to explain localized trends or supply chain logistics.
These Map Templates can be used for various use cases, such as a business expansion strategy within North America, a travel and tourism itinerary, or a national distribution overview. They are ideal for showing regional market share, highlighting specific territories for sales teams, or presenting environmental data during a sustainability review. The versatile, clean aesthetic ensures it fits perfectly into formal boardrooms or creative workshop settings alike.
Who Should Download this Mexico City Map
- Business development managers mapping out new franchise or store locations.
- Sales directors visualizing territory performance and regional quotas.
- Educational instructors teaching geography or international business relations.
- Logistics coordinators planning transportation routes across the country.
- Marketing analysts segmenting consumer data based on geographic regions.
Why Download this Map of Mexico City Template
- Illustrates regional data points clearly to help stakeholders make informed decisions.
- Features editable Mexican state boundaries for highly specific regional reporting.
- Professional design helps you look prepared and in control of your presentation.
- Includes diverse infographic elements like percentage circles and data callouts.
Key Features
- 100% Vector-Based Graphics
- Fully Layered & Organized
- Multi-Platform Support
- Theme Color & Theme Font
Frequently Asked Questions
- Can I move the location pins?
- Yes, all pins are individual elements that you can drag and drop to any specific city or state.
- Are the state colors customizable?
- Absolutely. Each state is a separate shape, so you can change the color to match your company branding or data intensity.
- Will this work on a Mac?
- Yes, the file is fully compatible with PowerPoint for Mac and can be opened easily in Google Slides.
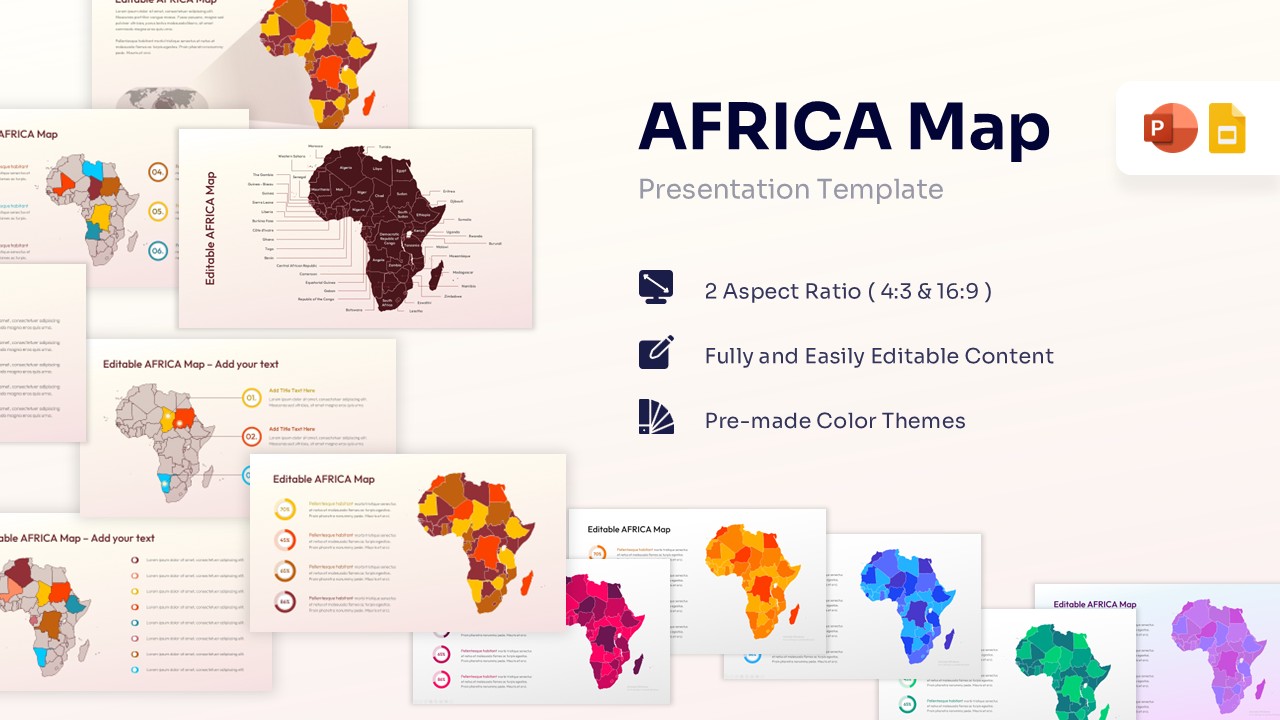
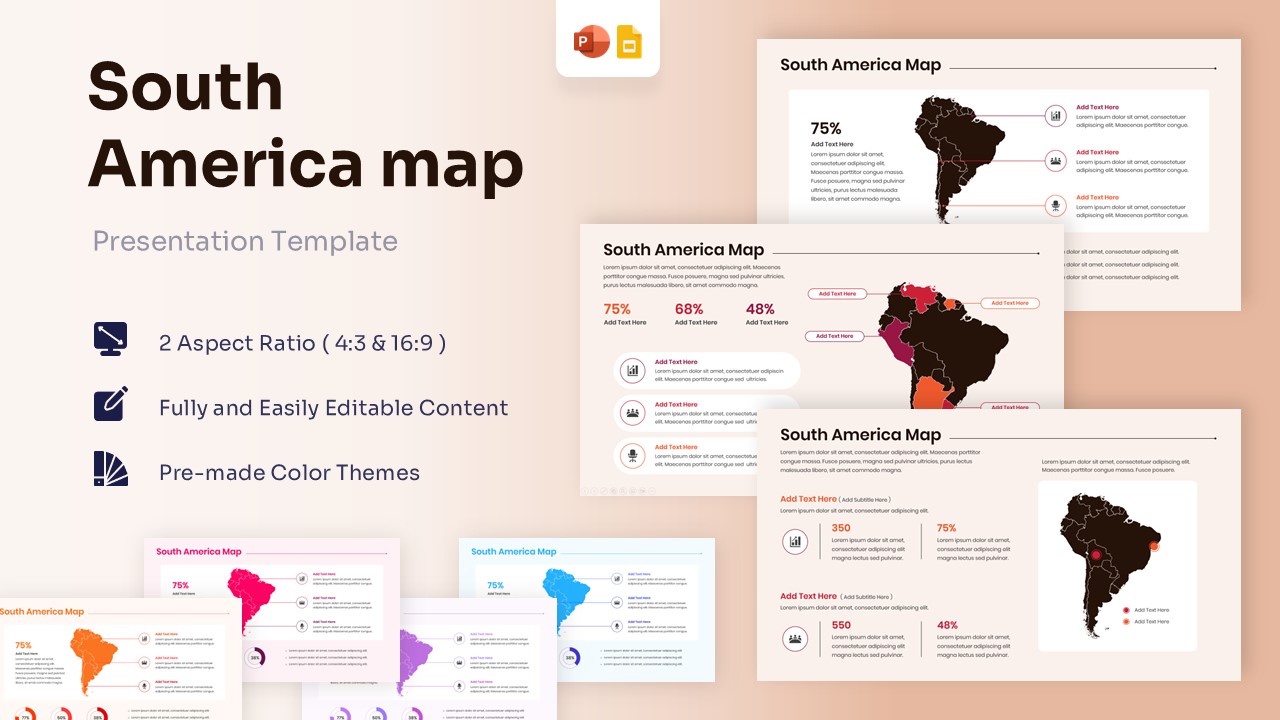
Related Templates
-
 $4.99
$4.99 -
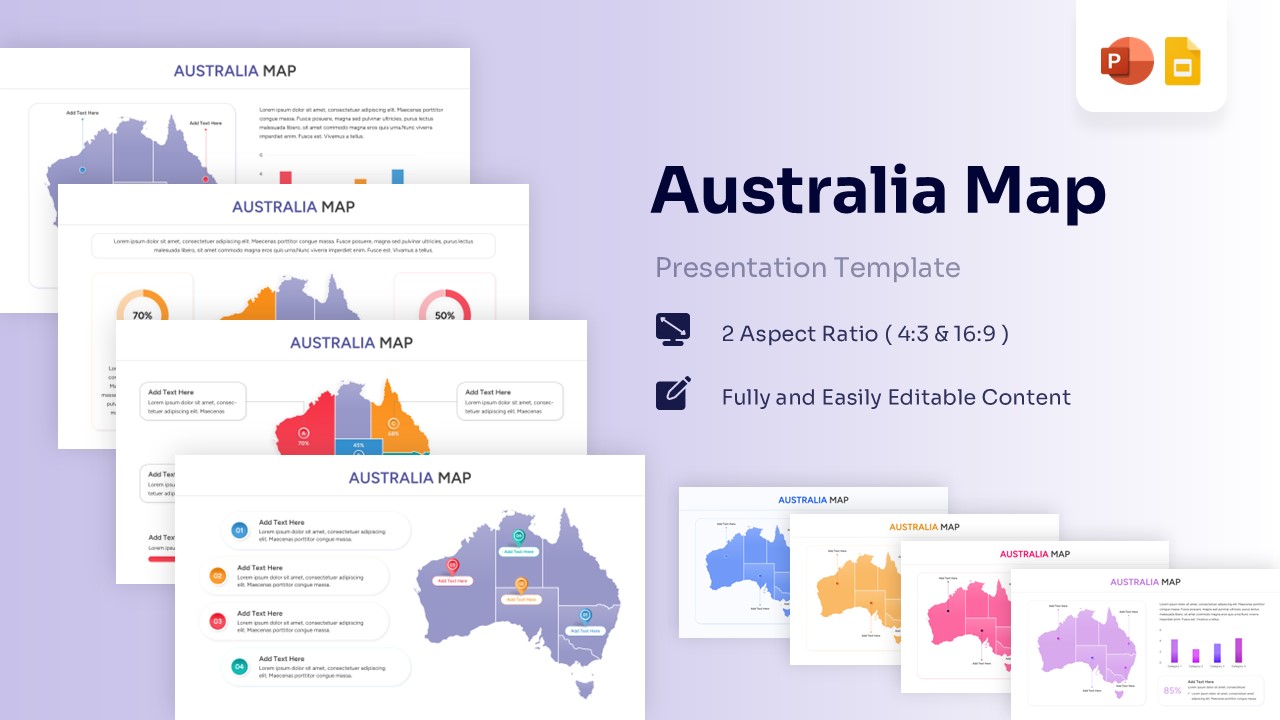
Australia Map for PowerPoint & Google Slides
Country Maps
$3.99 -
 $2.99
$2.99 -
 $3.99
$3.99