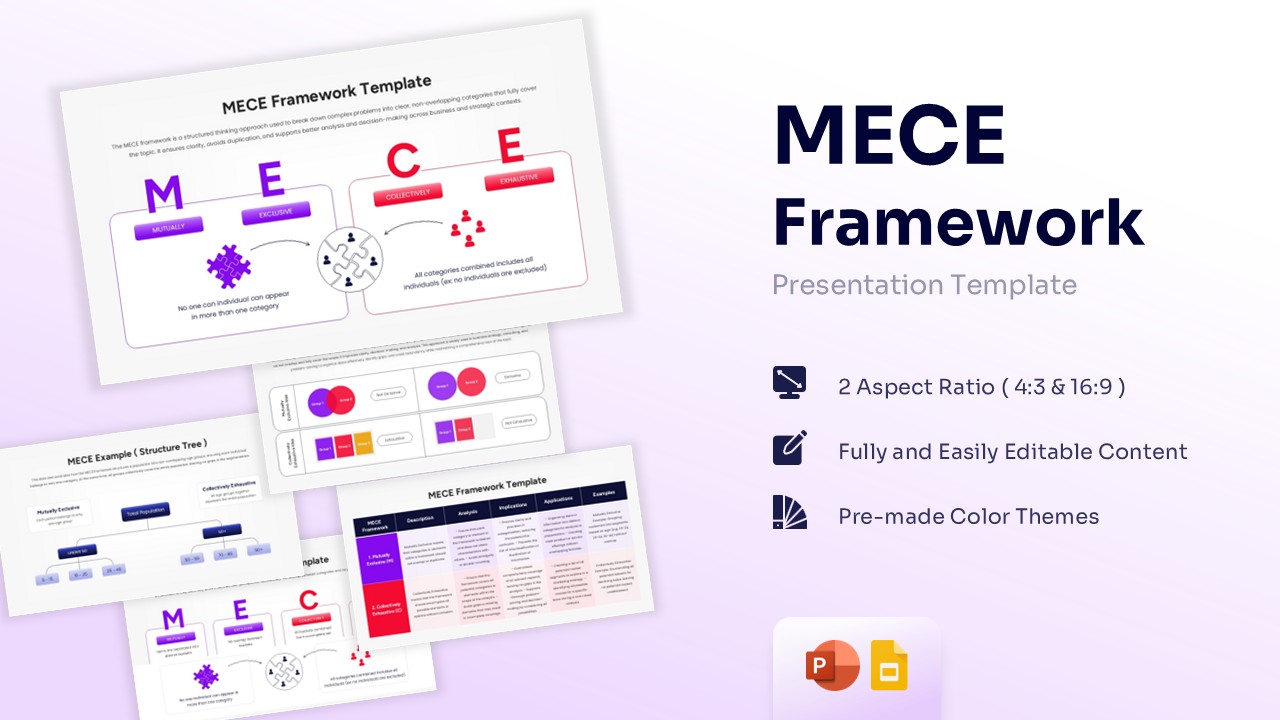
This slide uses the MECE Framework to visually define the two core principles of the methodology. It features circular Venn diagrams to illustrate overlap (not exclusive) and rectangular blocks to show coverage (exhaustive). This layout is perfect for training sessions to help teams understand how to avoid gaps in their data analysis.