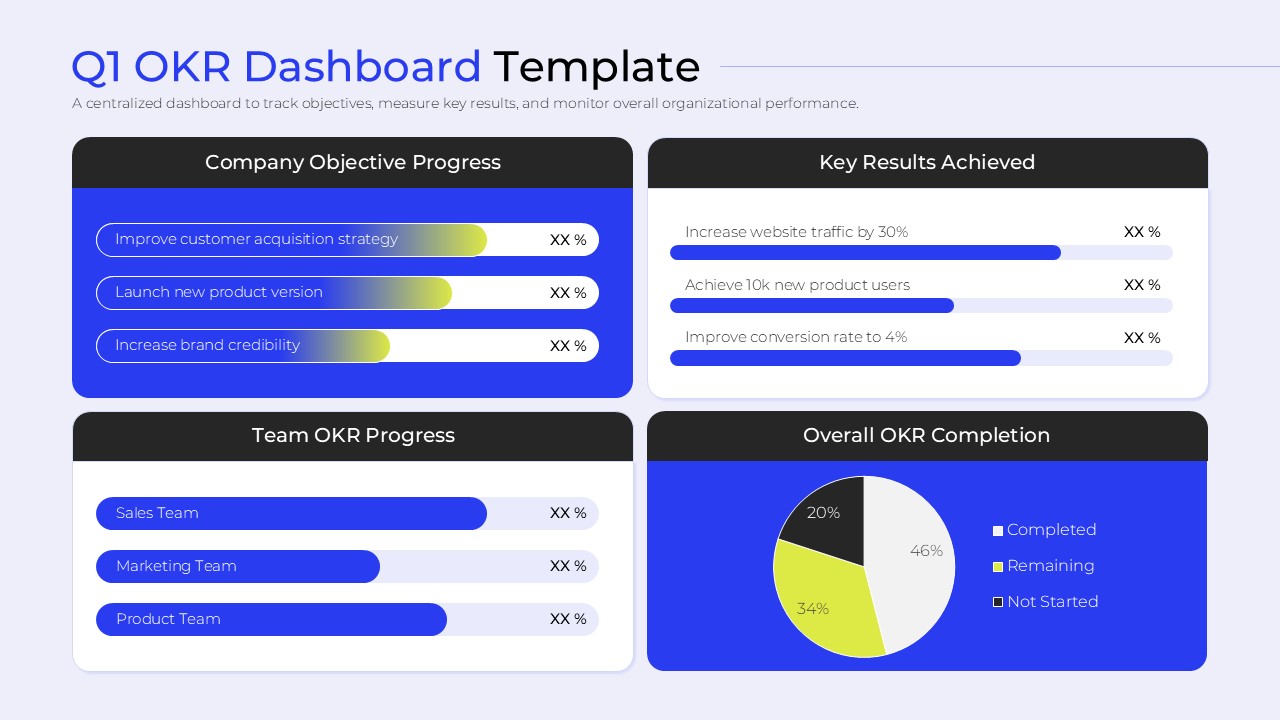
This quarterly-focused slide helps teams visualize the achievement of specific key results, such as website traffic and user acquisition. It features a prominent pie chart for overall completion and horizontal bars to track progress across different departments like Sales and Marketing. The high-contrast design ensures readability during professional presentations.