Professional Venn Diagram Infographic for PowerPoint & Google Slides


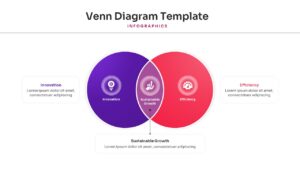
Multi-Circle Overlapping Relationships Presentation Template
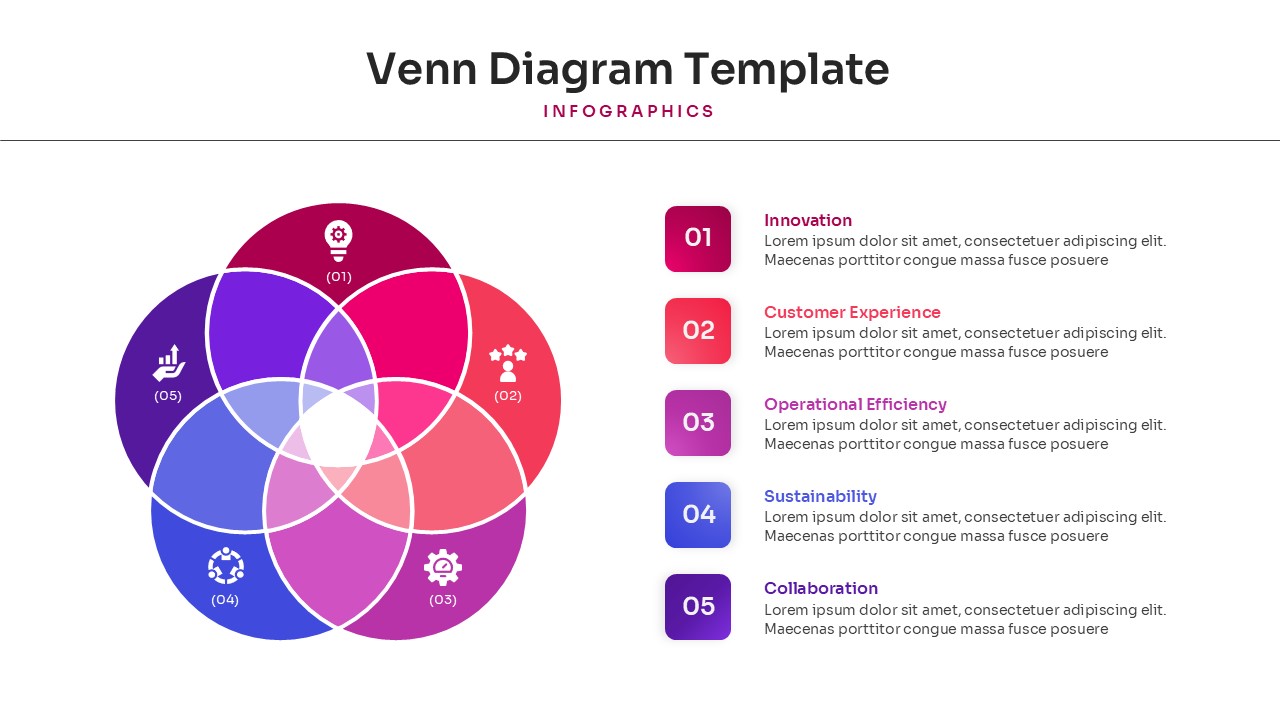
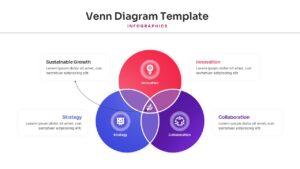
Download this Venn Diagram Template for PowerPoint & Google Slides to clearly show how different ideas or data sets overlap. Whether you are explaining market segments, shared project goals, or logical relationships, these clean visuals help your audience understand complex connections instantly. Using overlapping circles is one of the most effective ways to simplify data during business meetings or classroom lectures. This set includes various layouts, from simple two-circle comparisons to more intricate four-circle designs, ensuring you have the right tool for any presentation scenario.
This Venn diagram presentation template features a collection of professionally designed slides that focus on clarity and ease of use. Every shape is a vector-based graphic, meaning you can resize them without losing any sharpness or quality. You can easily change the colors of the overlapping sections to match your brand guidelines or highlight specific intersections. We have organized the layers so you can edit text and icons quickly, saving you valuable time when preparing your next deck.
These diagram templates are perfect for a wide range of professional and academic use cases. Marketing teams can use them to define target audience overlaps, while product managers might use a three-circle diagram to show the “sweet spot” between user needs, business goals, and technical feasibility. In educational settings, teachers can help students compare and contrast historical events or scientific concepts. Because these slides are compatible with both PowerPoint and Google Slides, you can collaborate with your team in real-time without worrying about formatting issues.
Why Use this Venn Diagram Templates
- Simplifies complex relationships into easy-to-read overlapping visuals.
- Save hours of design time with pre-built, polished circle layouts.
- Ensures a consistent, professional look across all your strategy slides.
- Fully customizable elements allow you to adapt the deck to your specific data.
Who Should Download this Venn Diagram
- Business analysts and strategists mapping out market opportunities.
- Educators and students looking for clear comparison tools.
- Project managers aligning cross-functional team responsibilities.
- Researchers presenting data sets with shared characteristics.
Key Features
- 100% Vector-Based Graphics
- Fully Layered & Organized
- Multi-Platform Support
- Theme Color & Theme Font
Frequently Asked Questions
- Can I change the number of circles in these diagrams?
- Yes, the template includes various layouts ranging from 2 to 4 circles. You can also duplicate or delete circles to fit your specific data needs.
- Are the overlapping areas of the circles individually editable?
- Absolutely. Each segment is a separate vector shape, allowing you to change the color or transparency of the overlapping parts to highlight specific data points.
- Will the formatting stay the same if I switch between PowerPoint and Google Slides?
- Yes, these templates are designed to be fully compatible with both platforms, ensuring your fonts and shapes remain perfectly aligned.
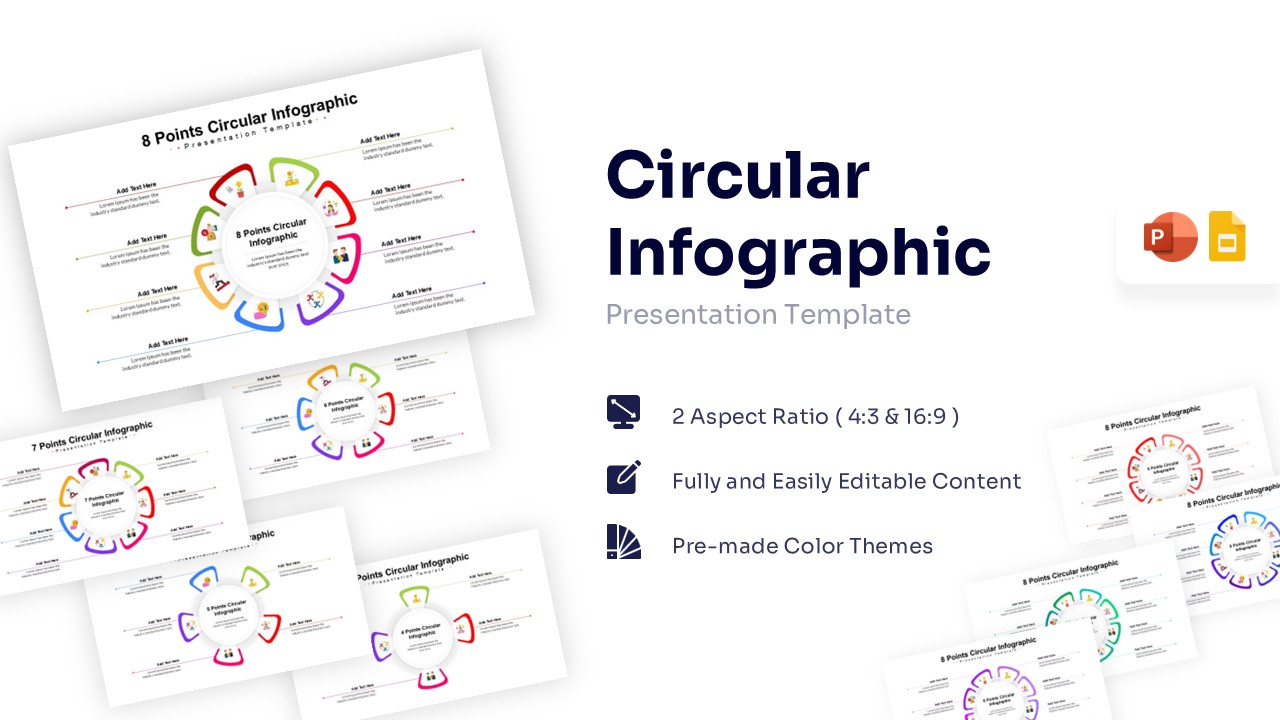
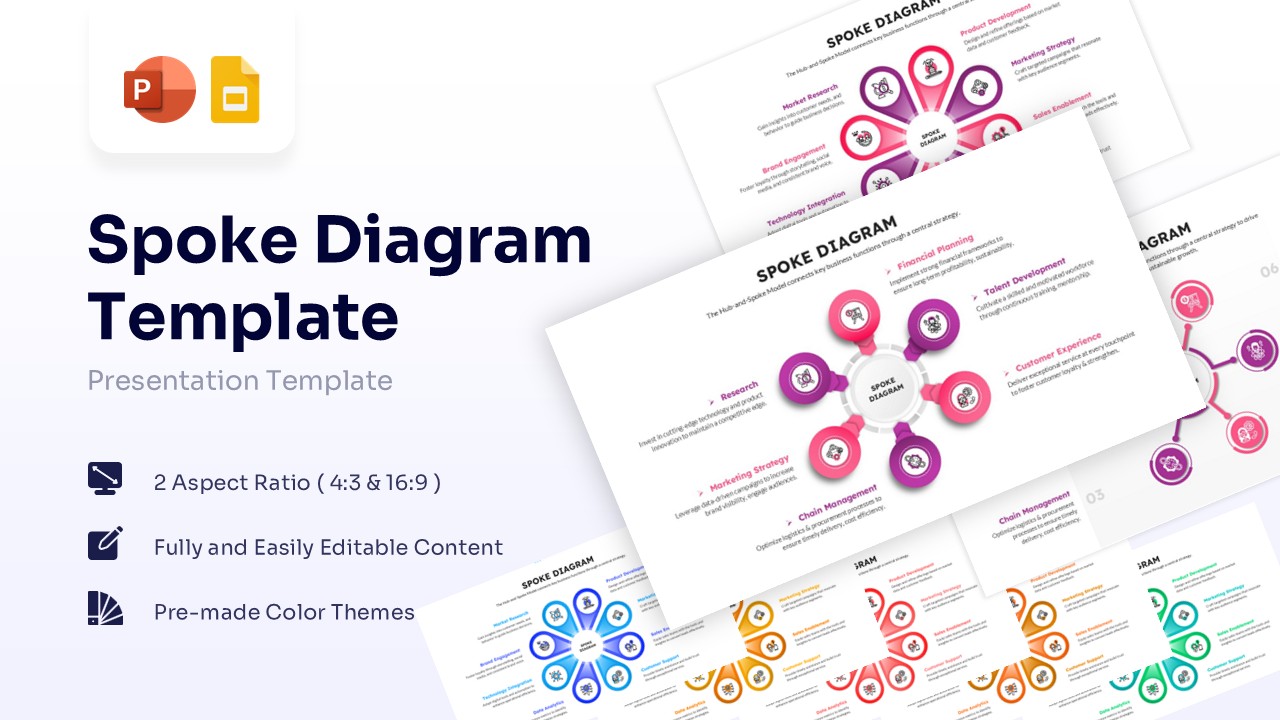
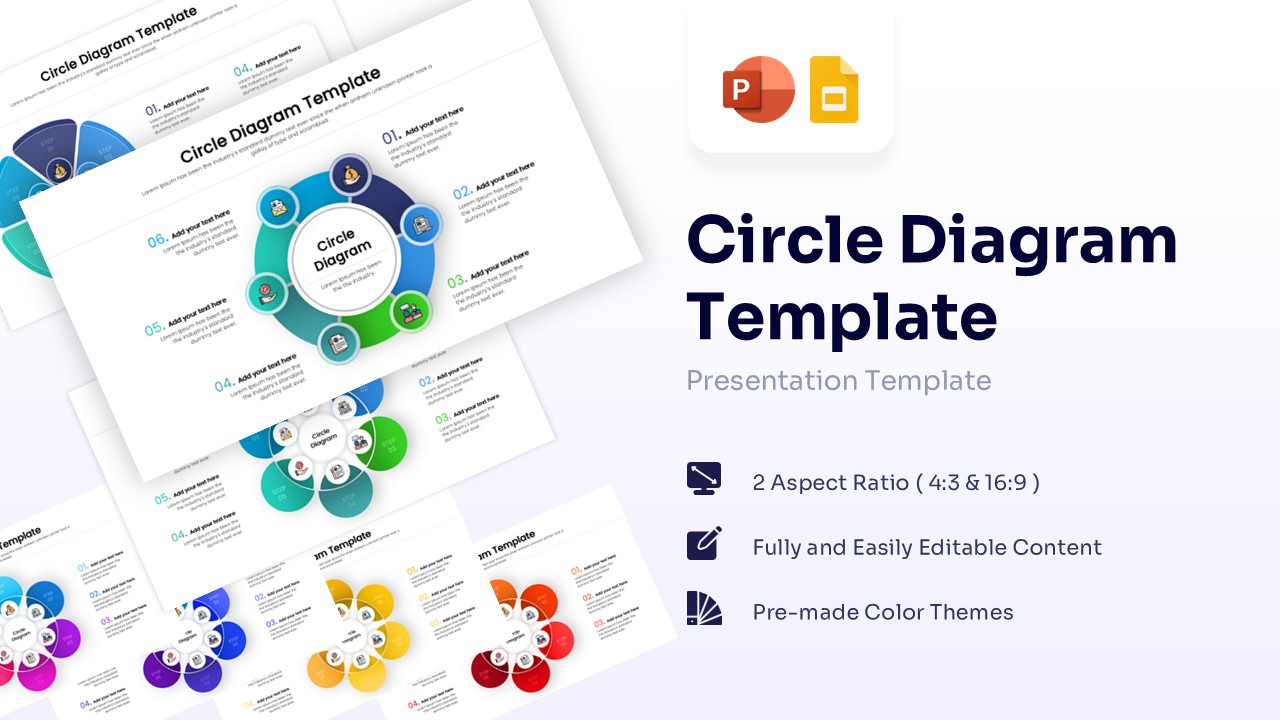
Related Templates
-
-
 $2.99
$2.99 -
 $2.99
$2.99 -