Project Management Gantt Chart Template for PowerPoint & Google Slides

Professional Gantt Chart Presentation Template
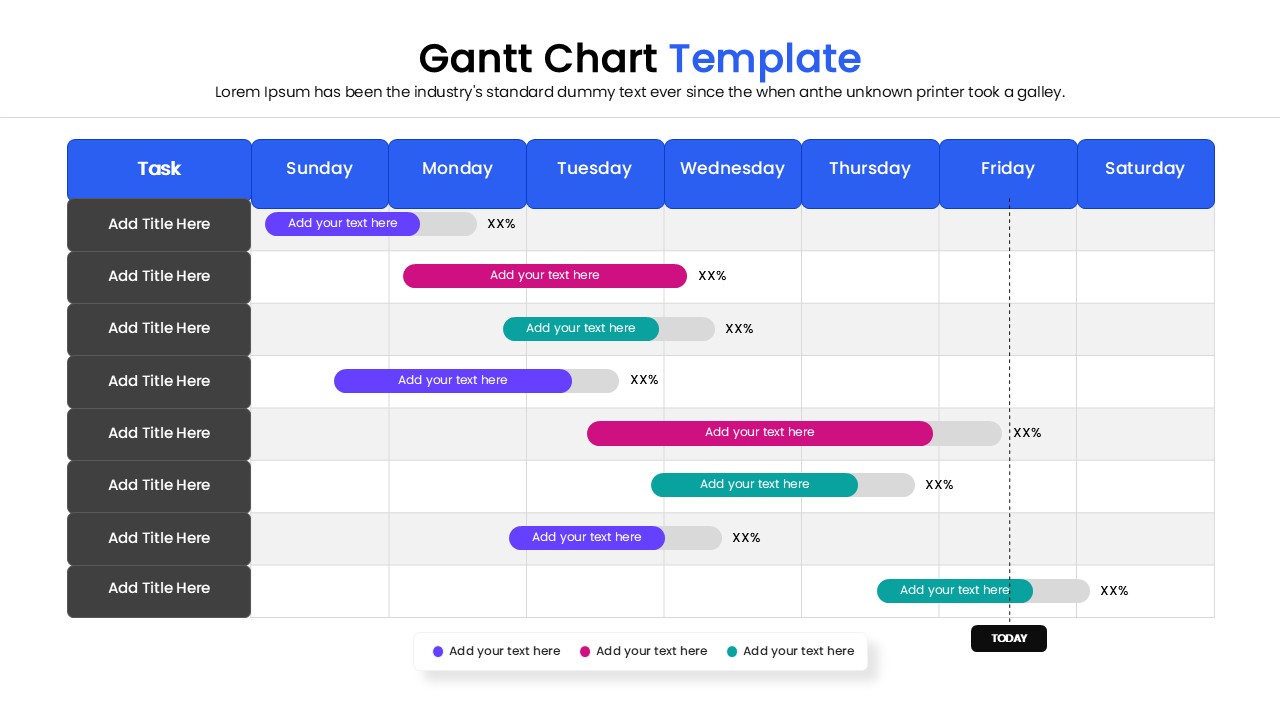
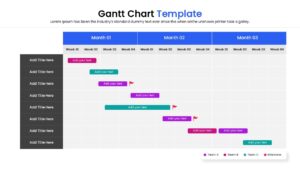
Download this Gantt Chart Template to bring immediate clarity to your project planning and scheduling. Whether you are mapping out a software development lifecycle, organizing a marketing campaign, or managing a construction timeline, this slide helps you visualize tasks effectively. It is designed to give your team and stakeholders a clear, comprehensive view of project progress at a single glance, ensuring that deadlines are met and expectations are managed right from the start.
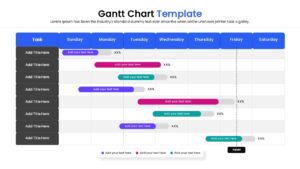
This Gantt Chart features a clean, intuitive layout with horizontal bars representing task durations against a clear calendar view. The design utilizes a multi-color scheme to easily distinguish between different project phases, teams, or priority levels. You can effortlessly adjust the length of the bars to reflect changing start and end dates, ensuring your schedule remains accurate. The template is fully editable, allowing you to customize text, colors, and fonts to match your corporate branding without needing advanced design skills.
These chart and graphs are incredibly versatile and can be used in a variety of professional settings. They are perfect for weekly status update meetings, quarterly business reviews, and initial project kickoffs. Use them to highlight critical paths, identify potential resource bottlenecks, and ensure every team member is aligned on key delivery dates. The layout fits seamlessy into business proposals, annual strategy decks, and operational reports, making complex time-data easy to digest for any audience.
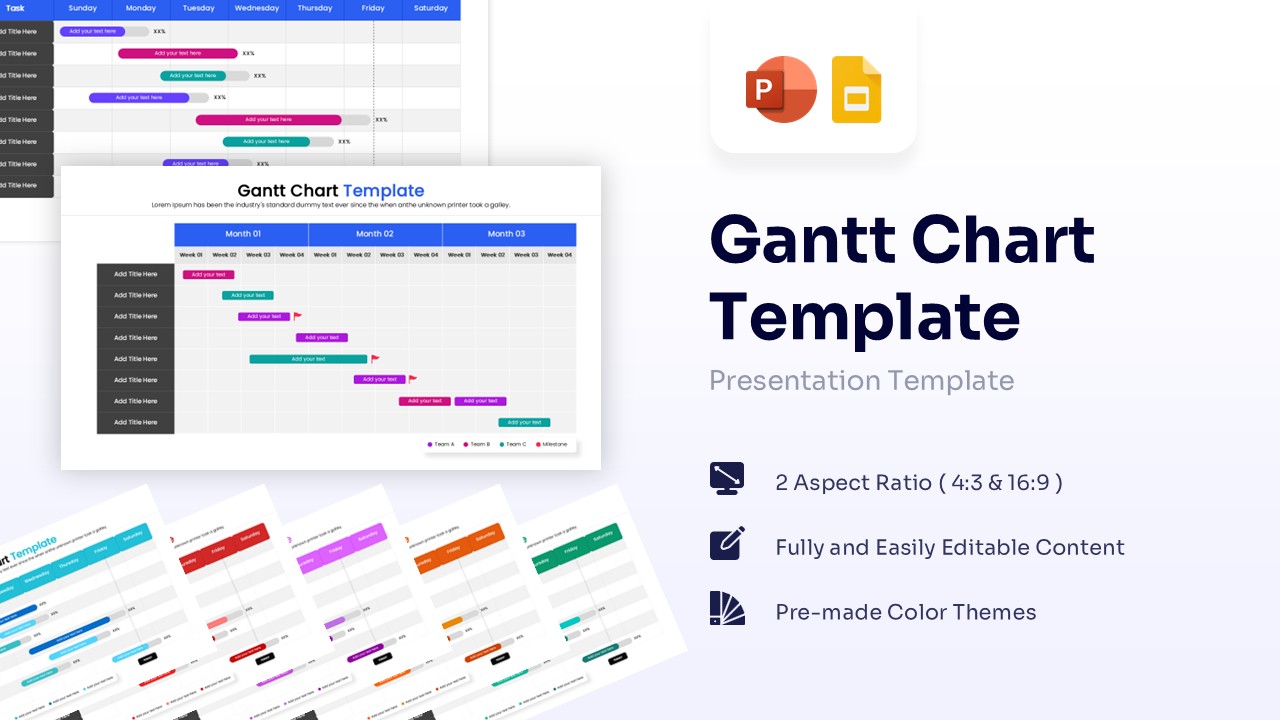
Features of this template
- 100% Vector-Based Graphics
- Fully Layered & Organized
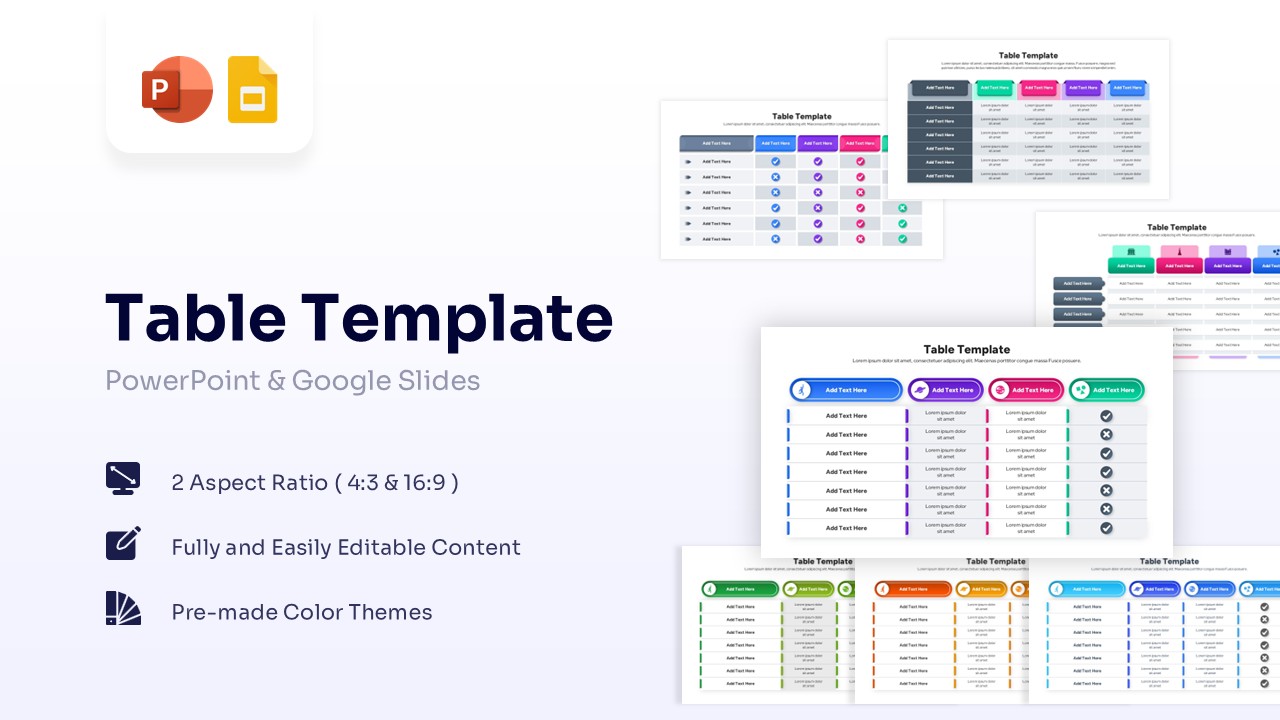
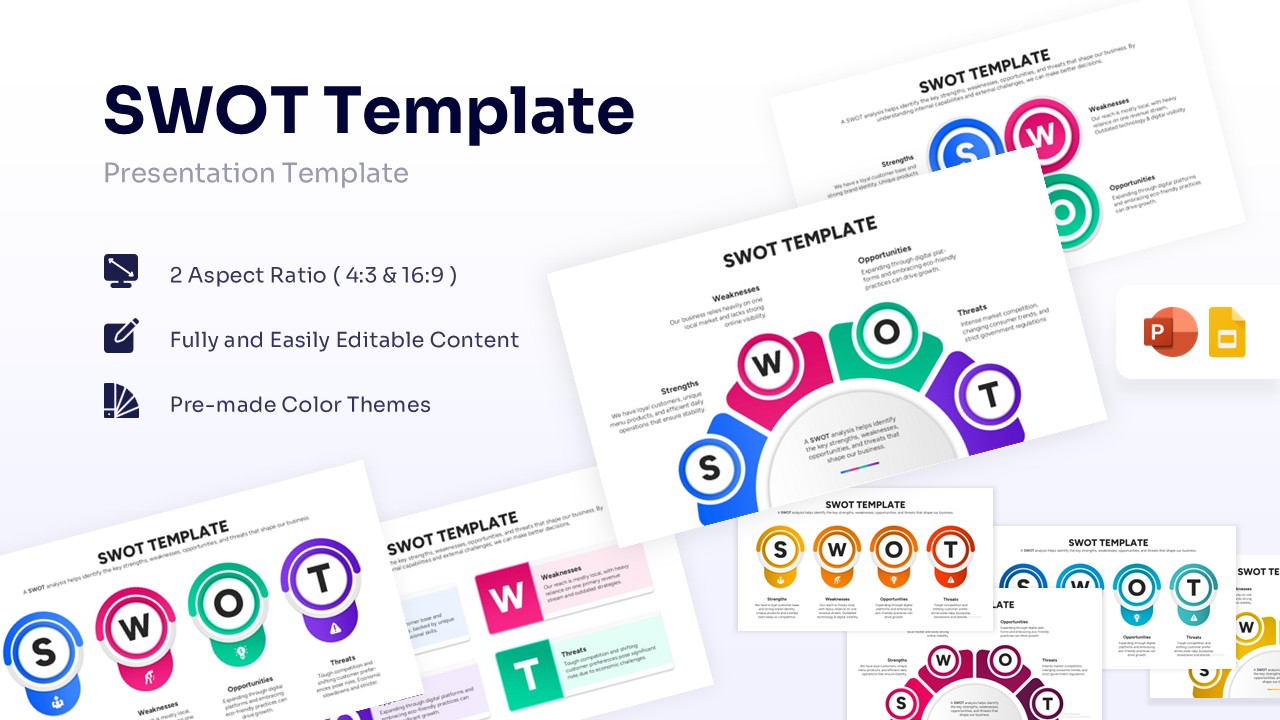
- Multi-Platform Support (PowerPoint & Google Slides)
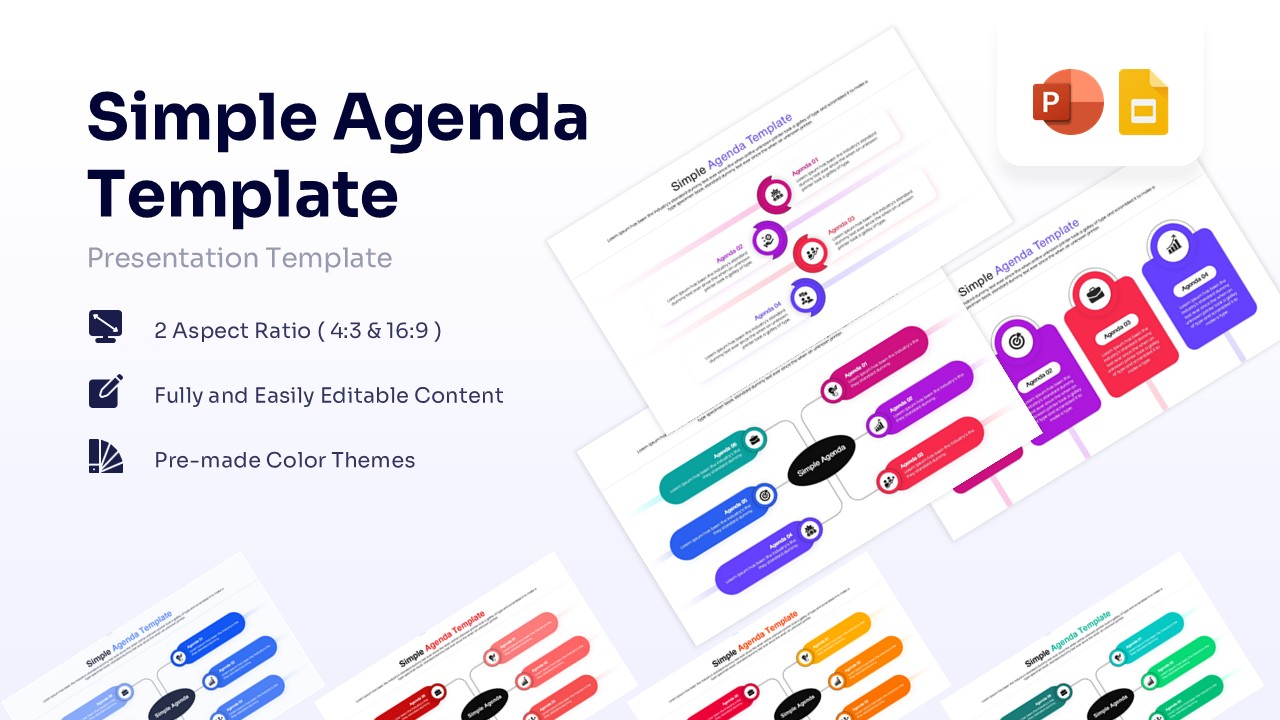
- 2 Aspect Ratios (4:3 & 16:9)
- Pre-made Color Themes
Why use this template
- Visualizes complex project schedules in a simple, easy-to-read format.
- Helps track progress against deadlines to keep teams accountable.
- Improves communication with stakeholders by providing a high-level roadmap view.
- Saves significant time compared to building a Gantt chart from scratch.
Who is it for
- Project Managers and Team Leads overseeing timelines and deliverables.
- Business Analysts and Consultants presenting project roadmaps to clients.
- Department Heads needing to track resource allocation and quarterly goals.
- Startup Founders outlining product development phases to investors.
Key Features
- 100% Vector-Based Graphics
- Fully Layered & Organized
- Multi-Platform Support (PowerPoint & Google Slides)
- 2 Aspect Ratios (4:3 & 16:9)
- Pre-made Color Themes
Frequently Asked Questions
- Can I change the time intervals on the chart?
- Yes, all text fields, including months and dates, are fully editable. You can customize the headers to show days, weeks, quarters, or years depending on your project scope.
- Is this template compatible with Google Slides?
- Absolutely. This template is designed to work seamlessly in both Microsoft PowerPoint and Google Slides.
- How do I adjust the length of the Gantt bars?
- The bars are vector shapes. You can simply click and drag the edges to shorten or lengthen them to represent the correct duration of each task.
Related Templates
-
 $2.99
$2.99 -
-
-