Quadrant Chart Strategy Matrix Template for PowerPoint & Google Slides
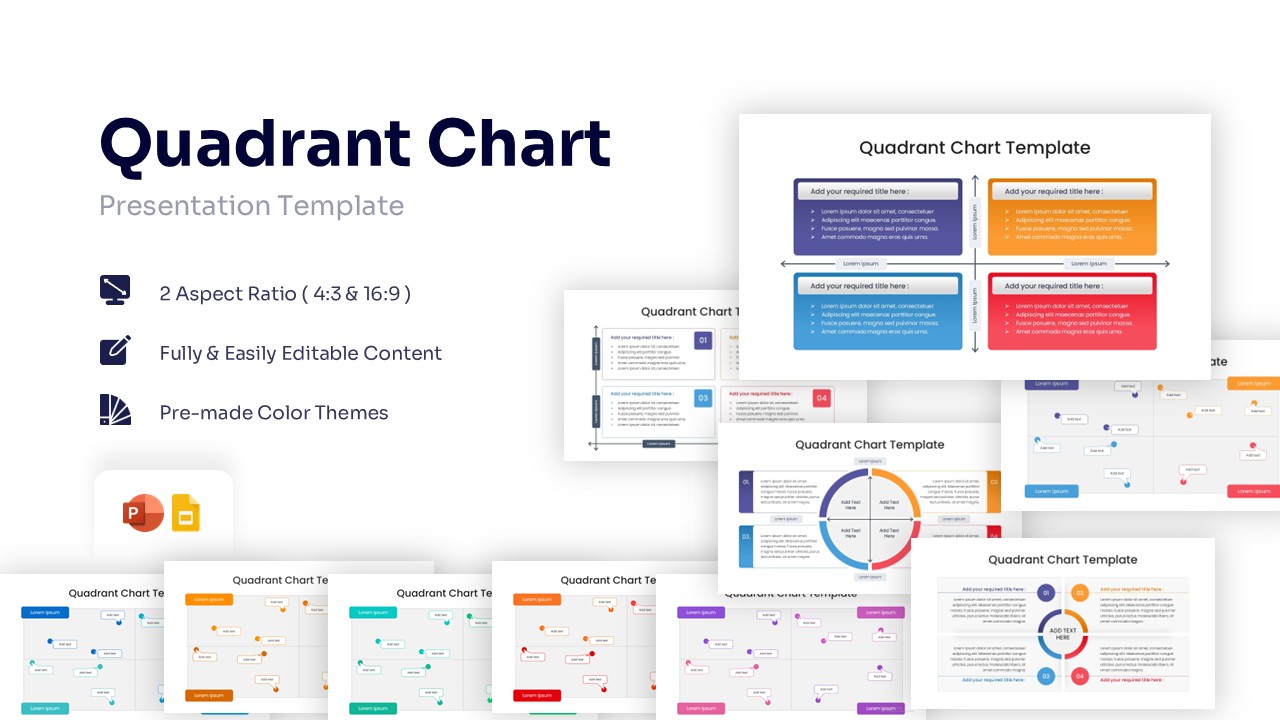


Four Quadrant Business Diagram Presentation Template
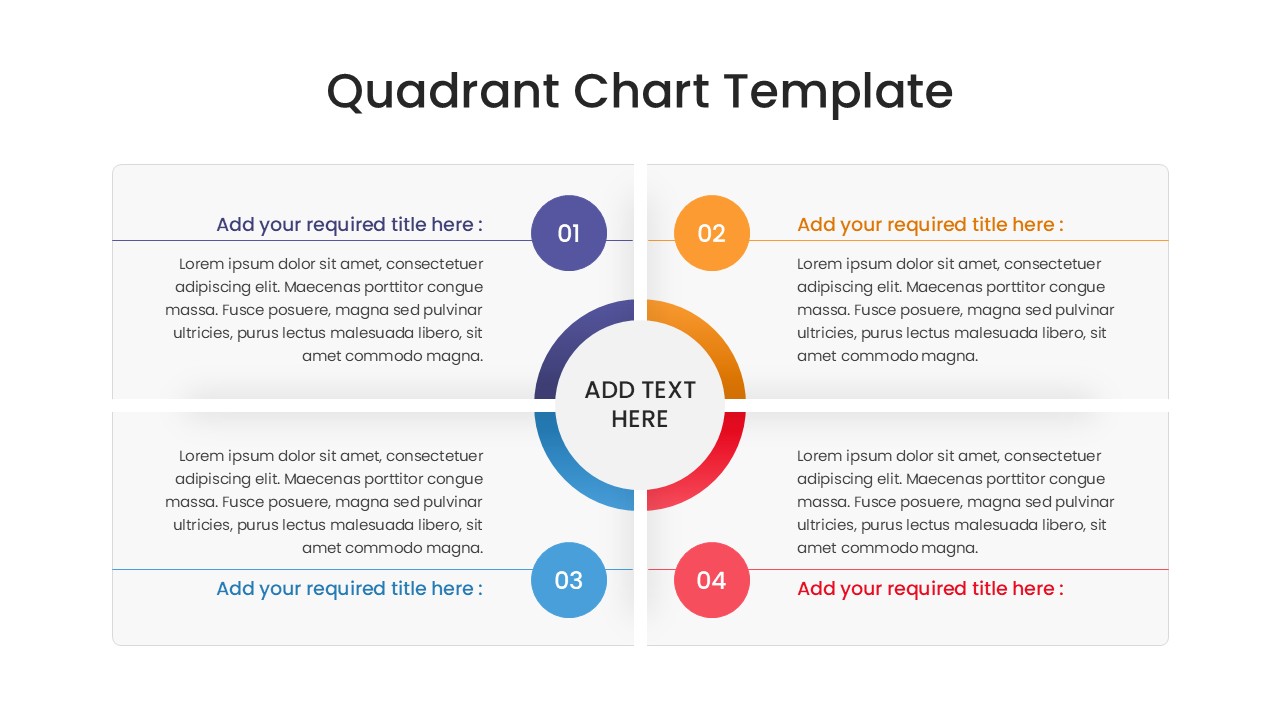
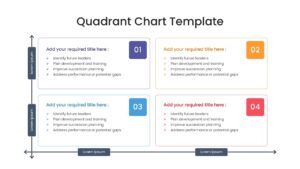
Download this Quadrant Chart Template to bring immediate clarity to your strategic planning and complex decision-making sessions. When you need to categorize scattered ideas or compare items against two key variables, this strategy matrix chart provides the reliable structure you need. This comparison chart infographic template is designed to help you organize information into four logical sections, making it significantly easier for your audience to grasp relationships, identify outliers, and understand priorities at a single glance.
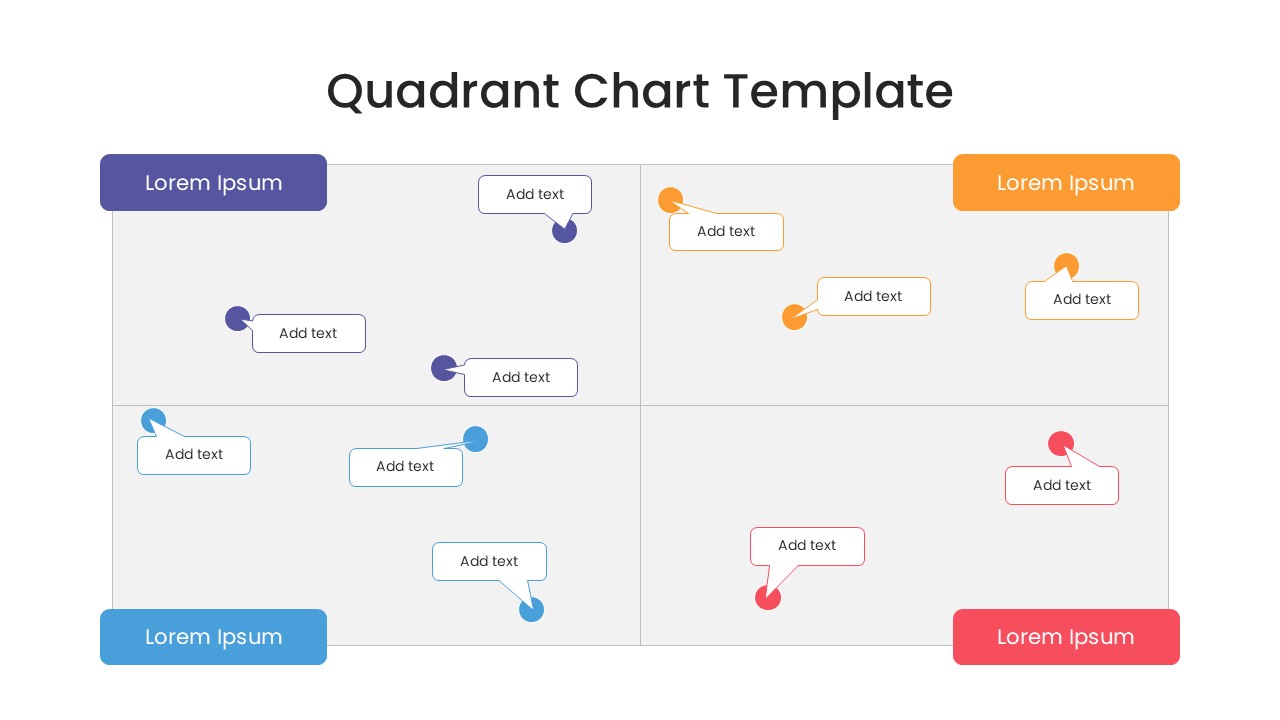
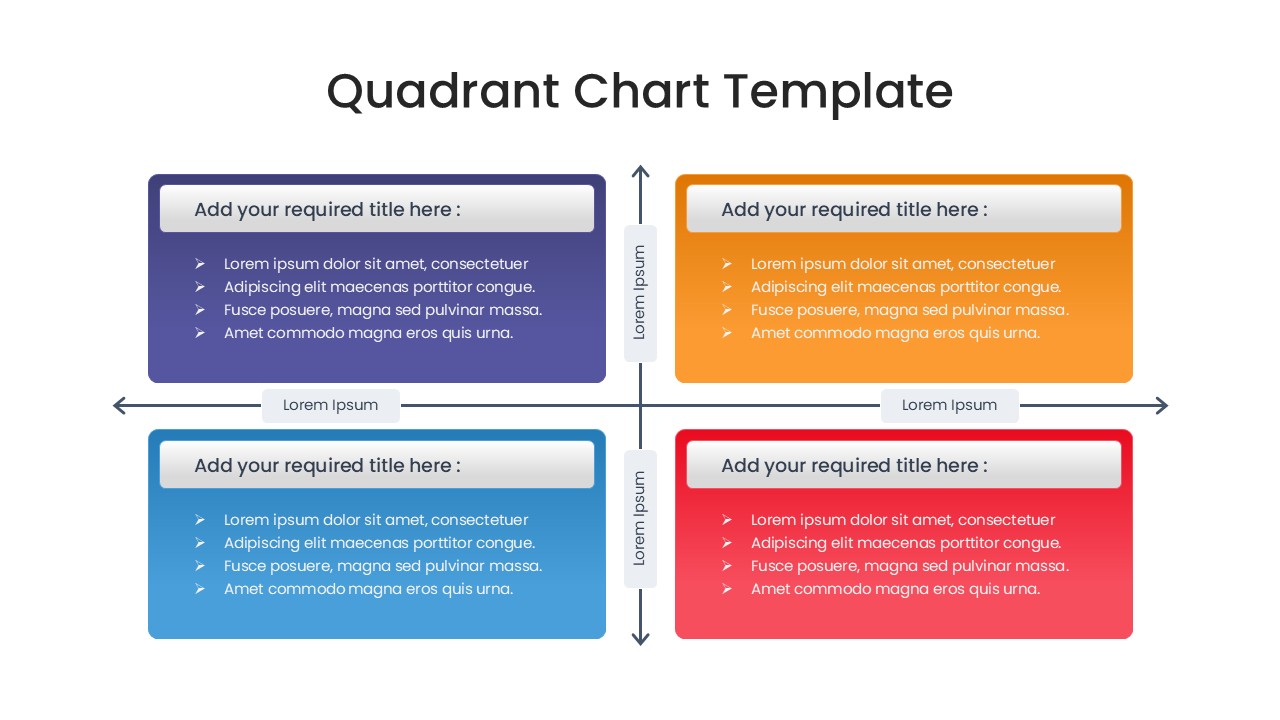
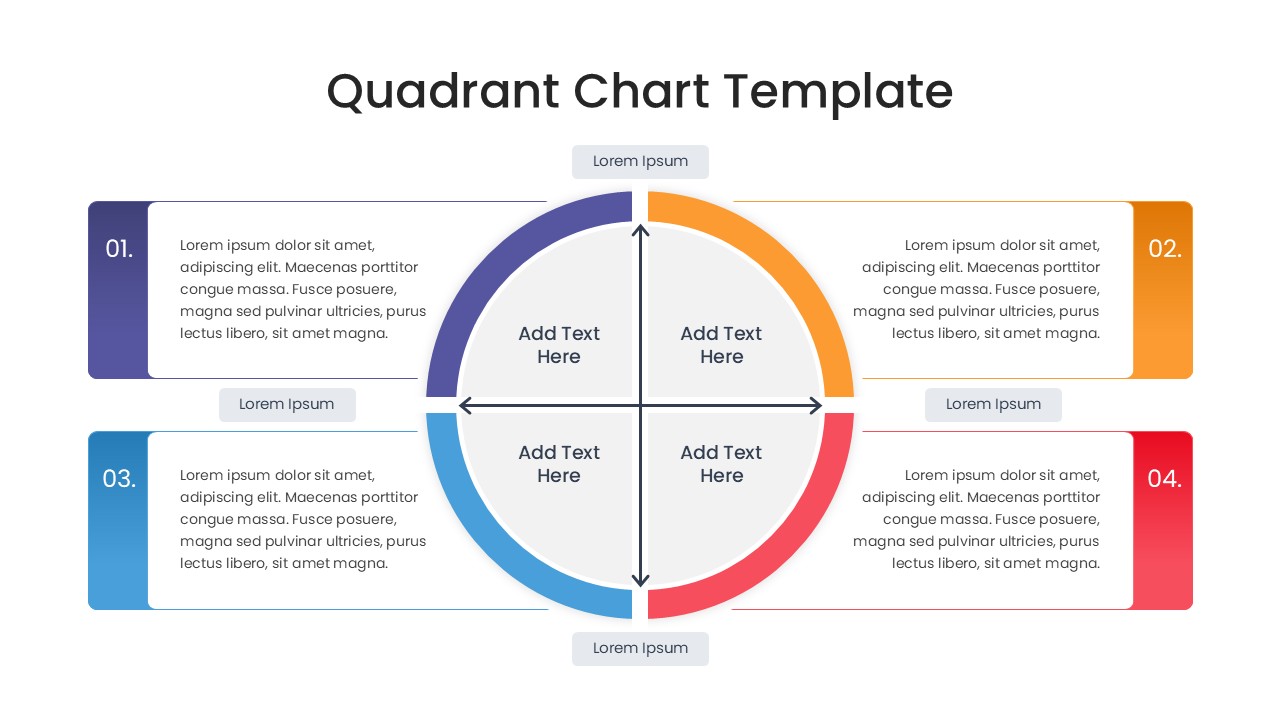
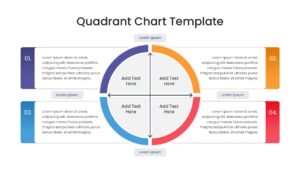
This quadrant chart template features a comprehensive variety of 2×2 matrix diagrams, ranging from traditional grid layouts to modern, fluid circular designs. You will find slides optimized for different specific needs, such as scatter-style plotting for managing granular data points or large text blocks for writing out detailed descriptions. The consistent and professional use of Purple, Orange, Blue, and Red helps visually distinguish each quadrant, while the clean typography ensures your key message always stays legible. You can quickly and easily adjust the axes labels, swap out the icons, and edit the text placeholders to perfectly match your specific analysis.
These layouts are incredibly versatile for your daily business needs and high-stakes presentations. You might use them to map out a detailed competitive landscape, clearly identifying where you stand against market rivals based on price and quality. They are equally effective for facilitating internal workshops, such as sorting team tasks by urgency and importance or conducting a standard SWOT analysis to identify strengths, weaknesses, opportunities, and threats. By visually separating your data into these four clear zones, you help stakeholders focus on specific areas of concern without ever losing sight of the bigger strategic picture.
Why Use this Quadrant Chart Comparison Template
- Transforms abstract comparisons into a clear, visual map for faster understanding.
- Encourages focused discussion on specific segments during strategy meetings.
- Adapts easily to various business frameworks like BCG, Ansoff, or Eisenhower matrices.
- Saves you time with pre-designed, professional structures that look great on any device.
Who is it for this Quadrant Chart Template
- Strategic planners and business consultants presenting market analysis.
- Product managers assessing feature value versus development effort.
- Team leads and project managers organizing backlogs and priorities.
- Marketing professionals defining customer segments and personas.
- Educators and trainers explaining four-part concepts or models.
Key Features
- 100% Vector-Based Graphics
- Fully Layered & Organized
- Multi-Platform Support
- Theme Color & Theme Font
- Versatile 2x2 Matrix Layouts
Frequently Asked Questions
- Can I change the colors of the quadrants?
- Yes, every element in this Quadrant Chart is fully editable. You can easily change the colors to match your company branding or specific category themes directly in PowerPoint or Google Slides.
- Is this template suitable for a SWOT analysis?
- Absolutely. The four-quadrant structure is perfect for SWOT analysis (Strengths, Weaknesses, Opportunities, Threats), as well as PESTLE analysis or risk assessment matrices.
- How do I edit the data in the scatter plot slide?
- The scatter plot elements are individual vector shapes. You can simply click and drag the \"pins\" or text bubbles to position them anywhere on the grid that reflects your data.
Related Templates
-
-
 $2.99
$2.99 -
 $3.99
$3.99 -