Your Cart
0 Assets added
Your cart is empty.
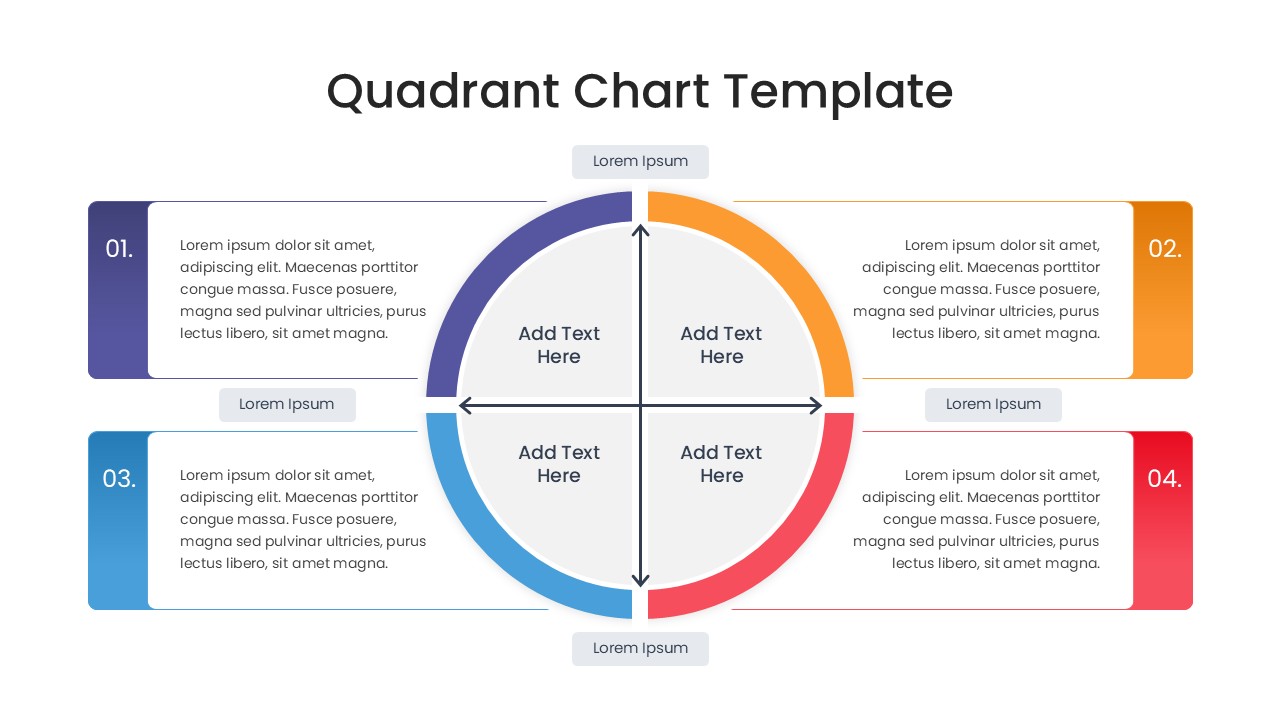
Home Quadrant Chart Strategy Matrix Template for PowerPoint & Google Slides Circular Matrix Infographic Slide
Split circle diagram divided into four colored sectors with directional arrows for business models
Product Highlights
No. of Slides
Category
Compatable With
Rating
0/5
(0 reviews)
Item ID
Author
Tags