Quadruple Venn Diagram Template for PowerPoint & Google Slides


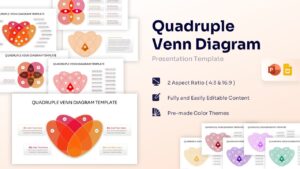


Venn Diagram Infographic Presentation Template
Download this Quadruple Venn Diagram and use case for illustrating complex relationships, overlapping data sets, and logical intersections in your next business or academic presentation. These versatile Venn Diagram Templates help you break down four competing or collaborating elements into a clear, visual format that anyone can understand. By using a structured four-circle layout, you can easily show where different departments, product features, or market segments overlap, helping your audience grasp the “sweet spot” of your strategy.
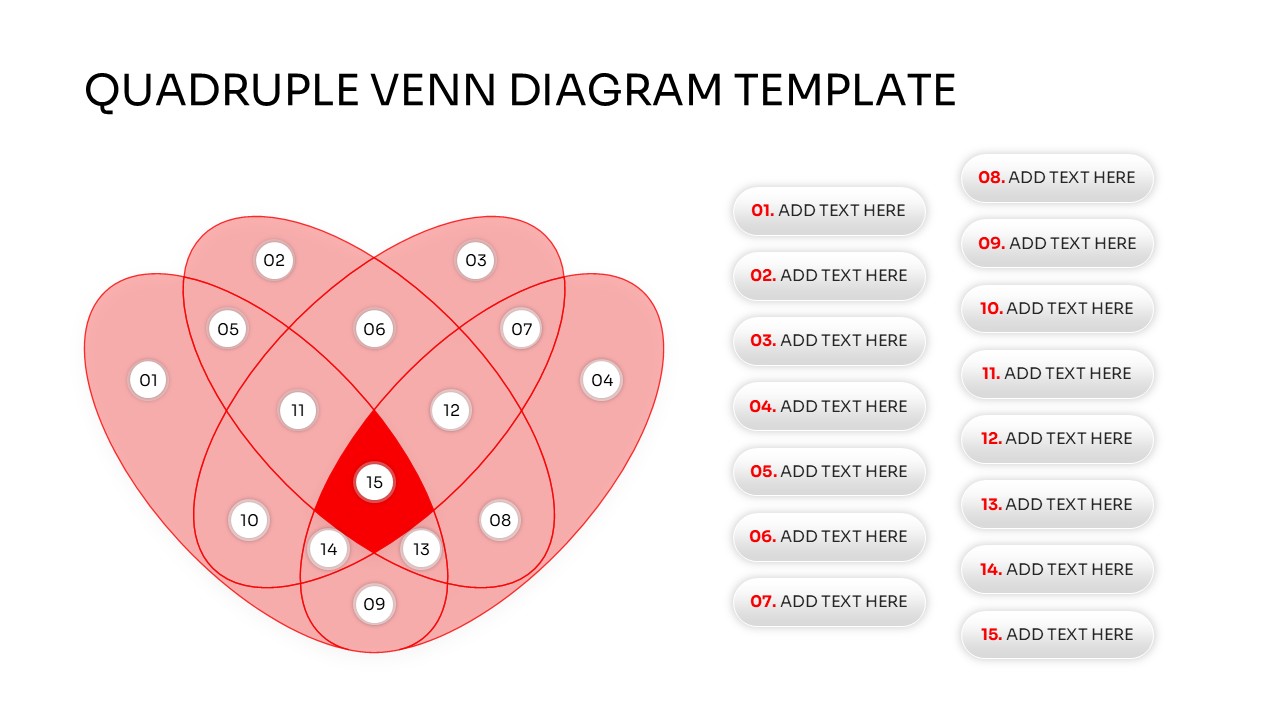
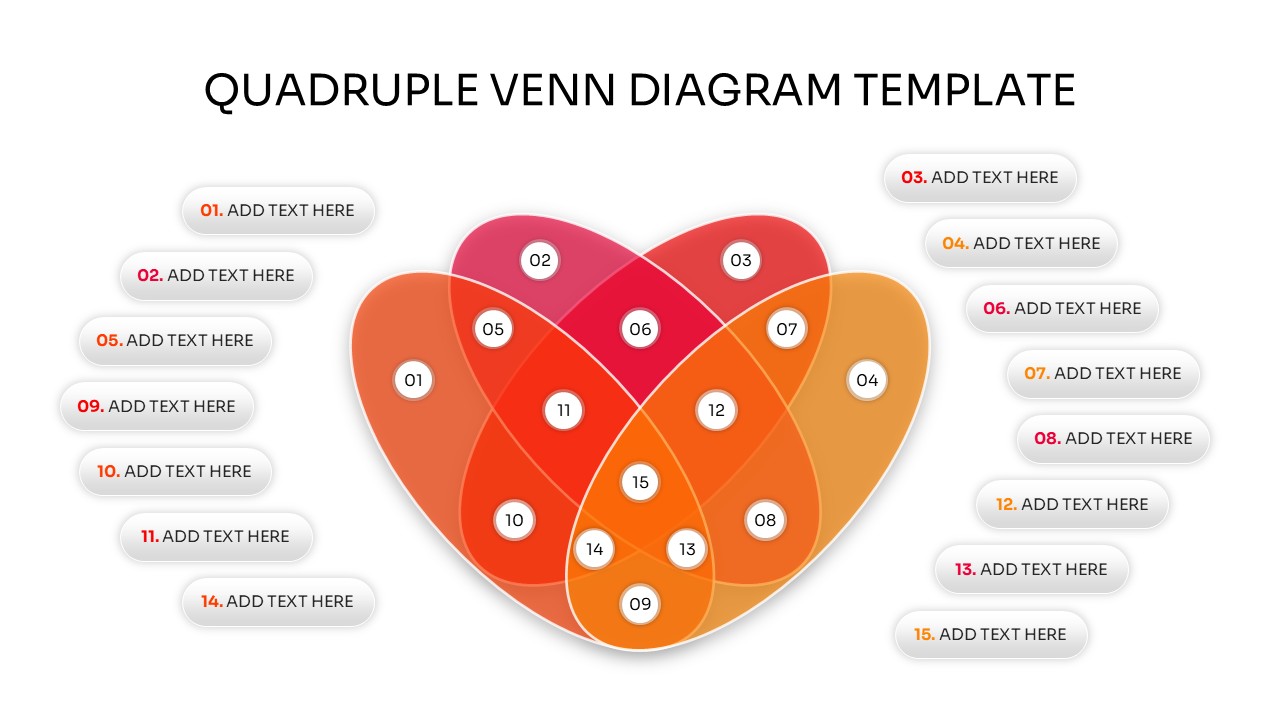
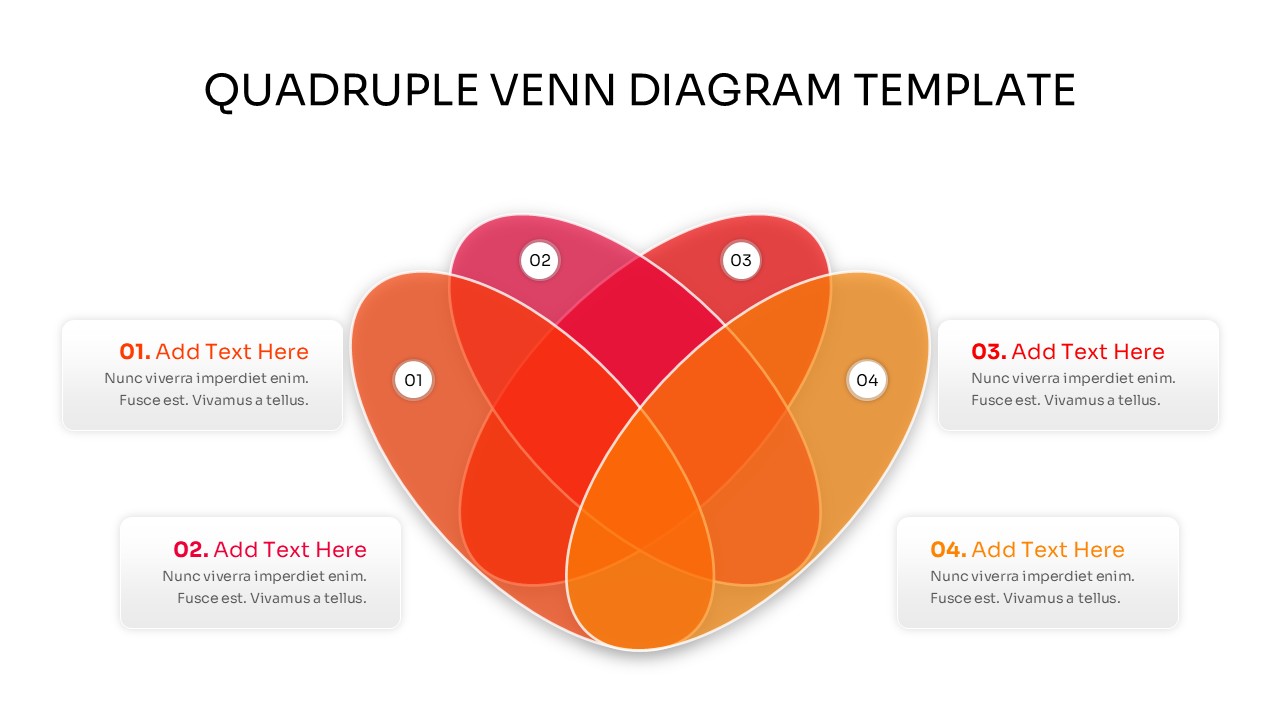
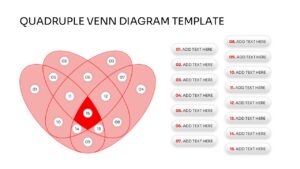
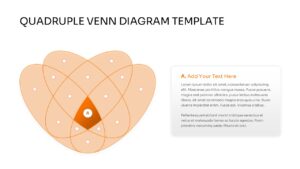
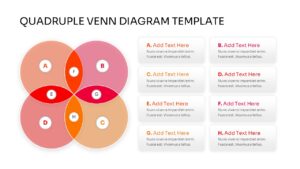
This Venn Diagram uses a sophisticated heart-shaped or petal-style intersection of four ovals, creating a professional and modern look. This quadruple Venn diagram presentation template is built with flexibility in mind, offering various layouts including numbered sections, icon placeholders, and side-by-side text descriptions. Whether you need to highlight the central core where all four areas meet or distinguish the unique traits of a single segment, these slides provide the high-fidelity graphics necessary to maintain a polished and trustworthy brand image.
In a professional setting, these PowerPoint diagrams are perfect for brand positioning, competitive analysis, and project management. Use them to map out the intersection of customer needs, technical feasibility, business viability, and market trends. The clean lines and organized structure ensure that your data doesn’t feel cluttered, allowing you to move from a raw idea to a finished, presentation-ready deck in just a few minutes.
Why Use this Quadruple Venn Diagram
- Simplifies complex data intersections into a professional visual format.
- Reduces prep time with pre-made layouts for four-way comparisons.
- Enhances clarity during strategic brainstorming and decision-making sessions.
- Ensures a consistent and polished look across all your corporate slides.
- Highly adaptable for different industries, from marketing to scientific research.
Who Should Download this Venn Infographics
- Business Analysts and Strategists who need to map out market segments, competitive advantages, or synergy between departments.
- Project Managers looking to define the overlap between resource allocation, timelines, budget constraints, and project scope.
- Marketing Managers and Brand Teams for visualizing target audience profiles, brand positioning, and content pillars.
- Educators and Researchers creating logical models, explaining mathematical sets, or presenting complex scientific overlaps.
- Consultants and Agency Leads who want to provide clients with a clear, high-level overview of strategic recommendations and intersections.
Key Features
- 100% Vector-Based Graphics
- Fully Layered & Organized
- Multi-Platform Support
- Theme Color & Theme Font
- 2 Aspect Ratios (4:3 & 16:9)
- Easily Editable Shapes and Colors
Frequently Asked Questions
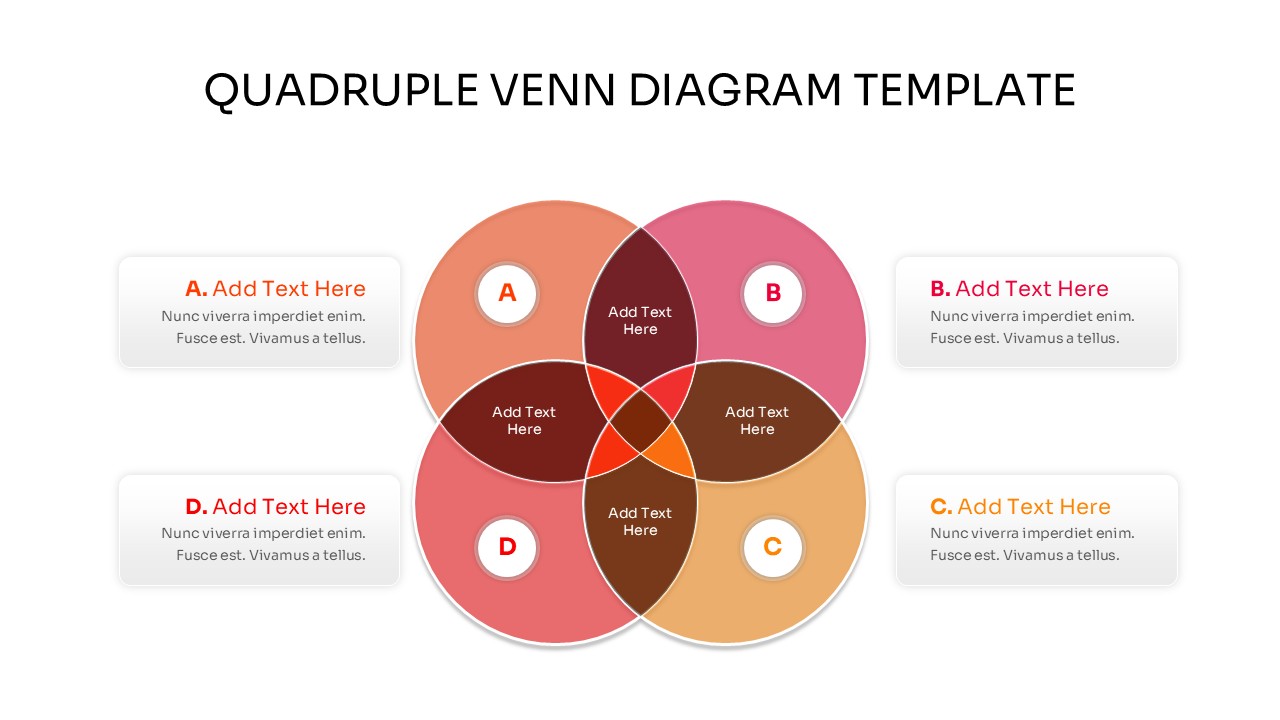
- Can I change the colors of individual intersections?
- Yes, every segment is a separate vector shape, allowing you to change colors to match your branding.
- Is this template compatible with Keynote?
- While designed for PowerPoint and Google Slides, the PPTX file can be imported into Keynote with high compatibility.
- How do I add more text to the circles?
- You can easily insert new text boxes or use the provided side-panel placeholders for detailed descriptions.