Risk Assessment Matrix Map Template for PowerPoint & Google Slides


Risk Impact Probability Matrix Presentation Template
Download this Risk Map Template and assess potential threats with confidence. This heat map template helps you identify, categorize, and prioritize risks effectively, ensuring your team is prepared for any scenario. By visualizing complex data, you can guide stakeholders toward informed decisions without getting lost in spreadsheets.
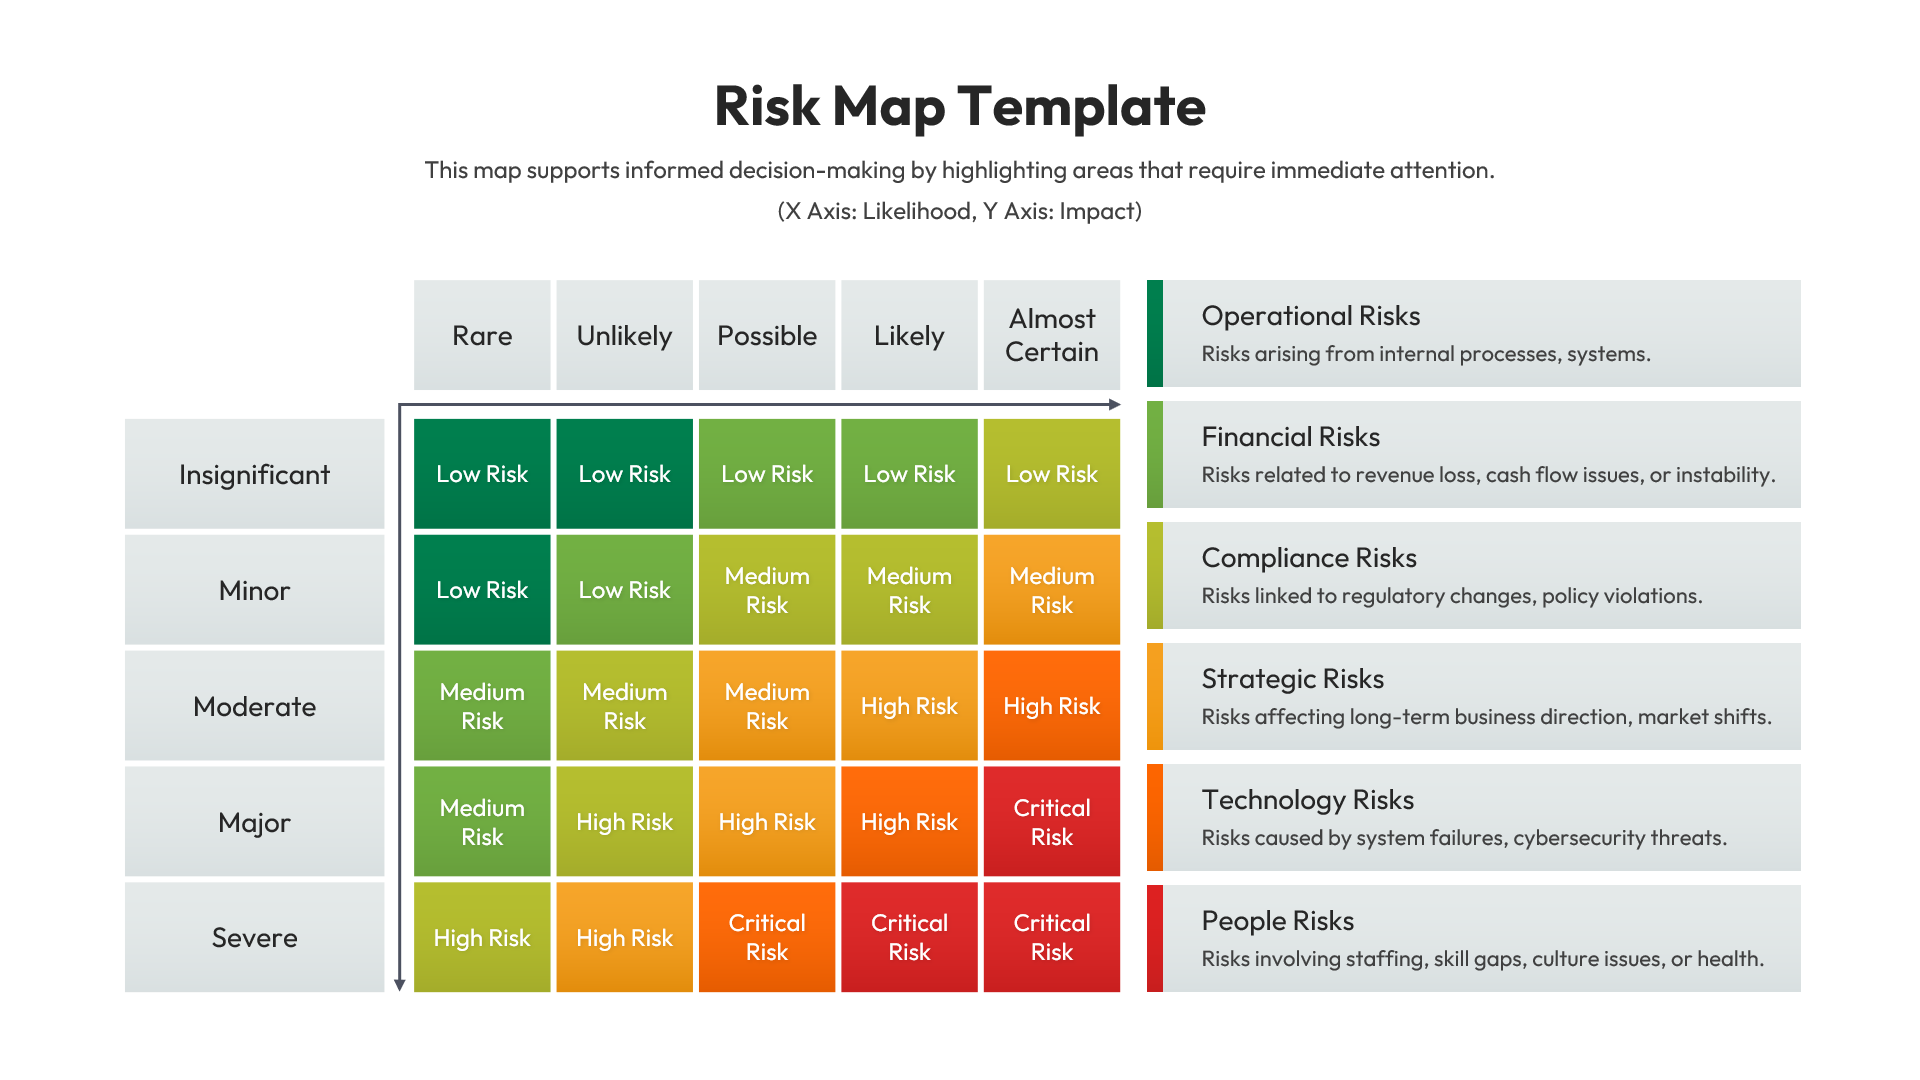
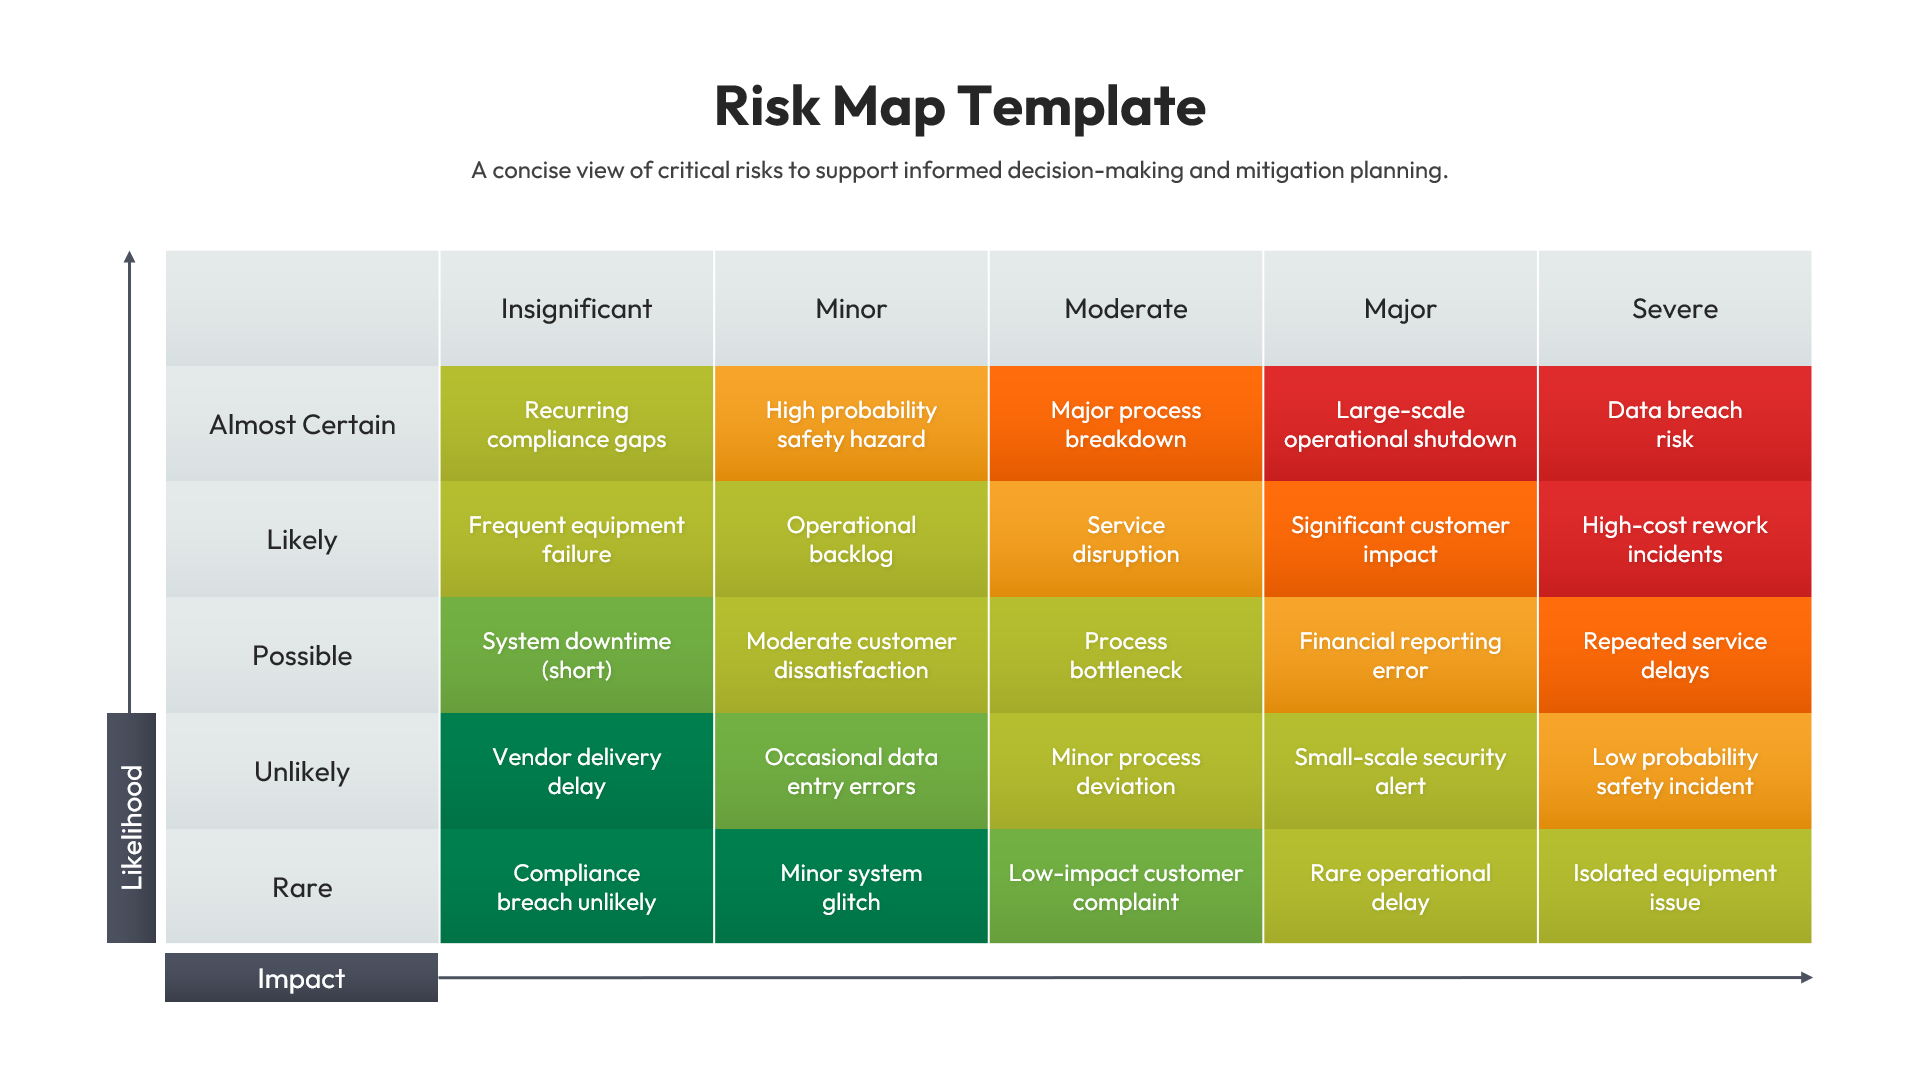
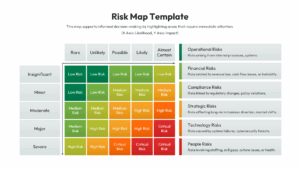
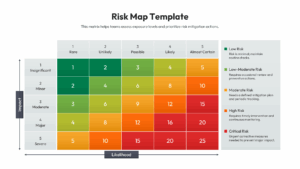
This risk assessment matrix diagram features a detailed risk assessment matrix, often called a heatmap. You will find a 5×5 grid plotting “Likelihood” against “Impact,” with color-coded zones ranging from low (green) to critical (red). It includes editable text fields for defining categories like operational, financial, and compliance risks, making it easy to tailor the probability impact grid to your specific industry needs. The clear layout ensures that high-priority issues stand out immediately.
Use this risk assessment business plan template for project planning sessions, quarterly business reviews, or safety audits. It simplifies the risk management process, allowing teams to spot vulnerabilities early. Whether you are presenting to a board of directors or a project team, this visual aid helps align everyone on the most pressing mitigation strategies.
Why Use this Risk Assessment Heat Map template
- Simplifies Complexity: Turns abstract risk data into a clear, visual story that is easy to digest.
- Prioritizes Action: Highlights critical risks instantly, helping teams focus resources where they are needed most.
- Enhances Professionalism: Provides a polished, corporate-ready look that establishes trust and authority.
- Saves Time: Pre-built structure allows you to focus on content rather than design mechanics.
Who Should Download this Heat Map Template
- Project Managers: To identify and track project-specific bottlenecks and threats.
- Risk Compliance Officers: For presenting safety audits and regulatory adherence reports.
- Business Strategists: To evaluate market risks and operational vulnerabilities during planning.
- Safety Inspectors: To categorize workplace hazards and safety incidents.
Key Features
- Comprehensive Matrix Layout: Includes 5x5 grids for detailed probability and impact scoring.
- Color-Coded Heatmap: Uses industry-standard green, yellow, orange, and red themes to indicate severity levels instantly.
- Fully Editable Content: Customize text, numbers, and categories (e.g., Operational, Strategic, Financial) to fit your context.
- Vector-Based Graphics: Resize elements without losing quality, ensuring a sharp look on any screen size.
- Multi-Platform Support: Works seamlessly in both PowerPoint and Google Slides.
Frequently Asked Questions
- Can I change the colors of the risk zones?
- Yes, every shape and color in this template is fully editable, so you can match your company\'s branding or specific risk coding system.
- Is this suitable for both small and large projects?
- Absolutely. The text is customizable, allowing you to simplify the grid for small projects or add detail for complex enterprise risk assessments.
Related Templates
-
-
 $3.99
$3.99 -
 $2.99
$2.99 -