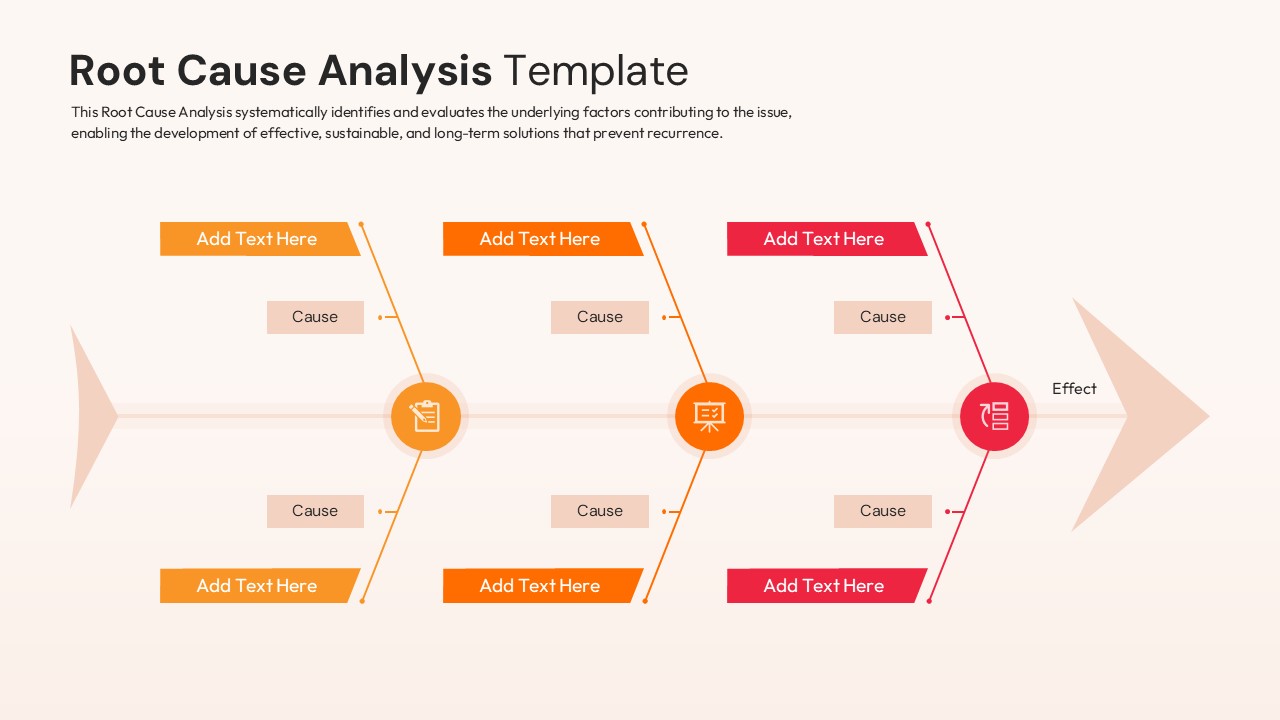
This design provides a streamlined version of the fishbone diagram with integrated icons for documentation, presentation, and data. It focuses on high-level categorization to prevent the audience from being overwhelmed by too many details. The vector-based structure allows for easy repositioning of the “bones” to fit your data.