Your Cart
0 Assets added
Your cart is empty.
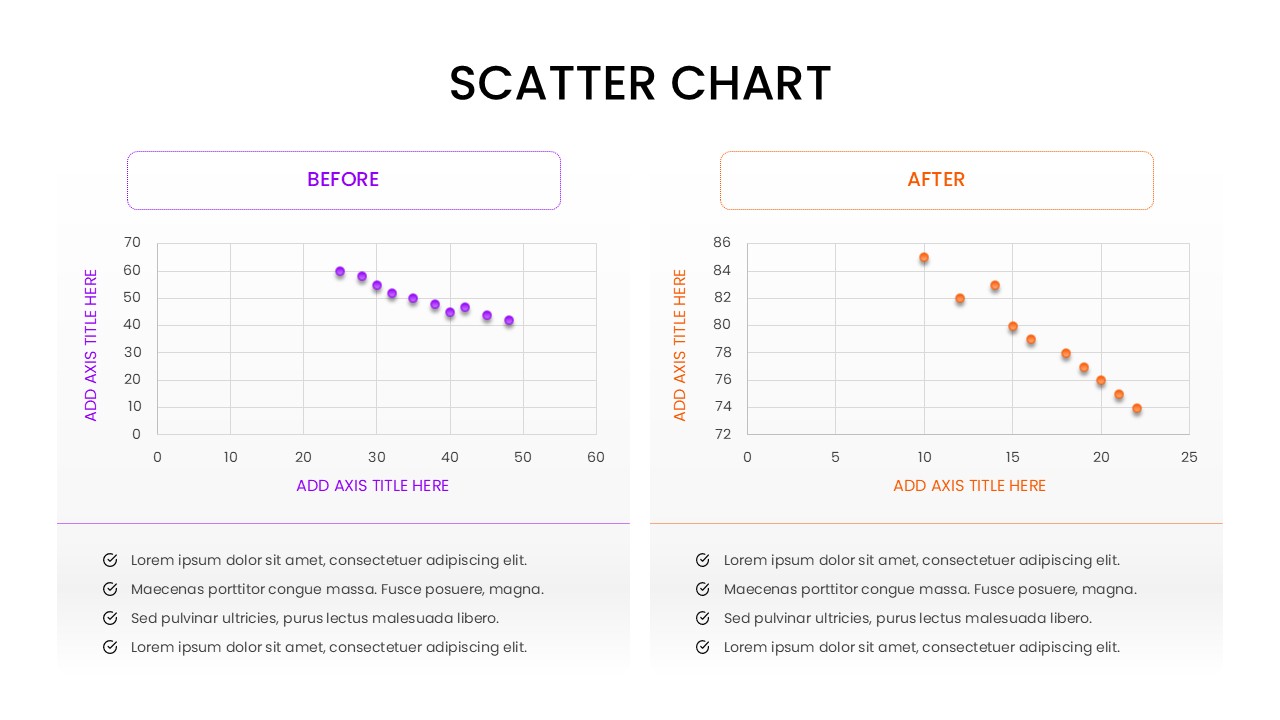
Home Scatter Chart Visualization Infographic Template for PowerPoint & Google Slides Before And After Comparison Scatter Chart
A “Before and After” comparison slide featuring two side-by-side scatter plots with purple and orange accents and bulleted list placeholders.
Product Highlights
No. of Slides
Category
Compatable With
Rating
0/5
(0 reviews)
Item ID
Author
Tags