Your Cart
0 Assets added
Your cart is empty.
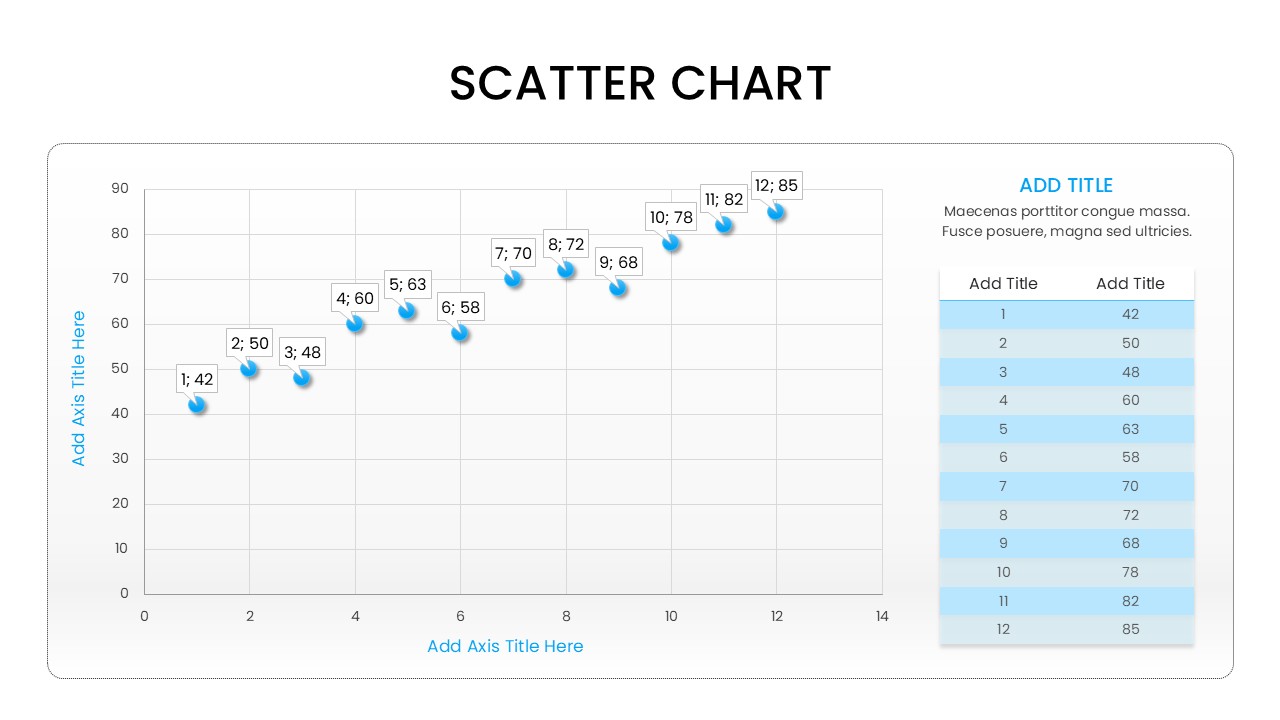
Home Scatter Chart Visualization Infographic Template for PowerPoint & Google Slides Data Table Scatter Plot Visualization
A detailed scatter chart visualization including numbered callout bubbles for specific data points and a corresponding data table on the right.
Product Highlights
No. of Slides
Category
Compatable With
Rating
0/5
(0 reviews)
Item ID
Author
Tags