Your Cart
0 Assets added
Your cart is empty.
Home Scatter Chart Visualization Infographic Template for PowerPoint & Google Slides Quadrant Scatter Plot Infographic
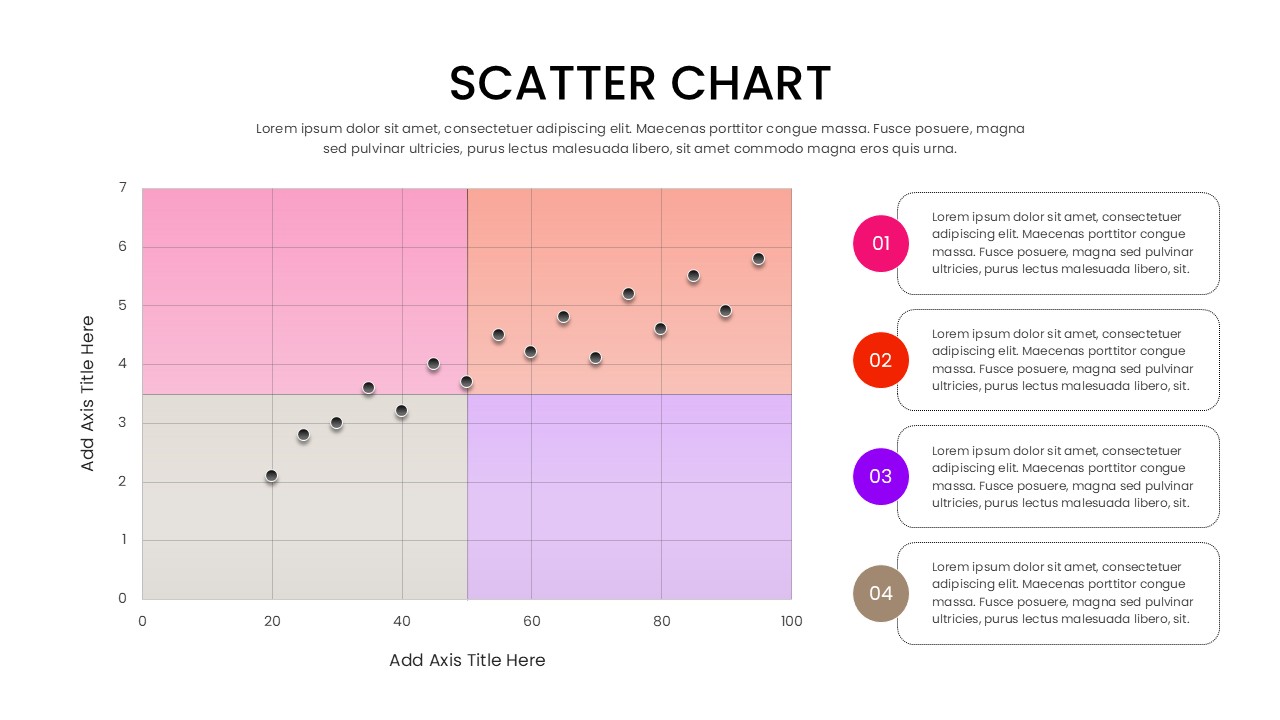
A 4-quadrant scatter chart infographic with color-coded sections (pink, orange, grey, purple) and side-aligned numbered list for data explanations.
Product Highlights
No. of Slides
Category
Compatable With
Rating
0/5
(0 reviews)
Item ID
Author
Tags