Your Cart
0 Assets added
Your cart is empty.
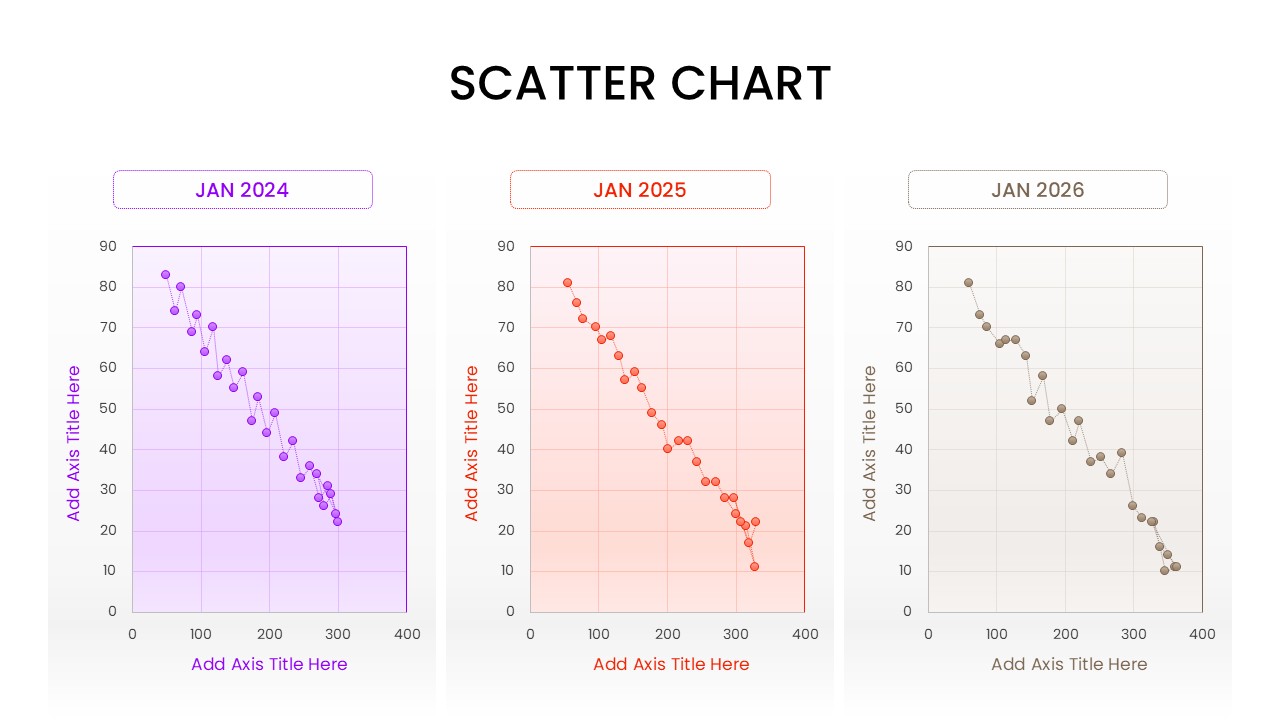
Home Scatter Chart Visualization Infographic Template for PowerPoint & Google Slides Yearly Performance Scatter Chart Comparison
A multi-chart presentation slide comparing scatter plots across three years (Jan 2024, Jan 2025, Jan 2026) using distinct color themes for trend tracking.
Product Highlights
No. of Slides
Category
Compatable With
Rating
0/5
(0 reviews)
Item ID
Author
Tags